Home › Market News › Tariffs, Volatility, and the U.S. Dollar Index

The Economic Calendar:
MONDAY: NY Fed Manufacturing Survey (7:30a CT), Retail Sales (7:30a CT), Business Inventories (9:00a CT), NAHB Housing Market Index (9:00a CT), Retail Inventories (9:00a CT), NOPA Crush Report (11:00a CT)
TUESDAY: Building Permits (7:30a CT), Import/Export Prices (7:30a CT), Housing Starts (7:30a CT), Redbook (7:55a CT), Industrial Production/Capacity Utilization (8:15a CT), Manufacturing Production (8:15a CT), 20-Year Bond Auction (12:00p CT), 2-Day FOMC Meeting Begins
WEDNESDAY: MBA Mortgage Applications (6:00a CT), CPI (7:30a CT), EIA Petroleum Status Report (9:30a CT), Fed Interest Rate Decision (1:00p CT), Fed Press Conference (1:30a CT), Overall Net Capital Flows (3:00p CT)
THURSDAY: Jobless Claims (7:30a CT), Philly Fed Manufacturing Index (7:30a CT), CB Leading Index (9:00a CT), Existing Home Sales (9:00a CT), EIA Natural Gas Report (9:30a CT), Fed Balance Sheet (3:30p CT)
FRIDAY: Fed Williams Speech (8:05a CT), Baker Hughes Rig Count (12:00p CT)
Key Events:
This week, several major central banks will announce their monetary policy decisions. Here’s what to expect…
U.S. Federal Reserve (FOMC):
Bank of England (BoE):
Bank of Japan (BoJ):
High-yield spreads, the yield differential between riskier corporate debt and safer Treasury bonds, serve as a barometer for credit risk and investor confidence. Typically, these spreads expand during economic downturns, as investors demand higher returns to offset increased default risk, and contract during periods of economic stability.
Until recently, high-yield spreads remained notably compressed, reflecting a period of robust economic growth and low default rates. Data indicated spreads consistently below historical averages, with figures as low as 289 basis points in late 2024 and remaining under 400 basis points for an extended period. Despite occasional market volatility, this tightness signaled investor comfort, driven by attractive yields and a resilient economy.
Recently, high-yield spreads began to widen significantly. In the last weeks, we saw a 19 basis point jump in a single day, the largest since August 2024, and some spreads approaching 600 basis points.
While still below recessionary levels, this shift aligns with broader market turbulence and suggests a growing risk aversion in credit markets.
port.

Source: X.com
The once-reliable “buy-the-dip” mentality, a hallmark of recent market rallies, appears to be slipping away as traders grapple with heightened volatility and lingering valuation concerns.
While bargain hunters may be selectively deploying capital, a broader shift towards capital preservation is evident, sidelining many who are wary of renewed risk-taking.
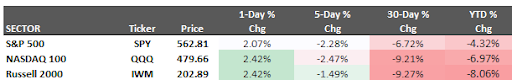
After a tumultuous 16-day stretch marked by daily intraday declines of at least 1%, the Nasdaq 100 finally broke the pattern with a notable 2.4% gain on Friday. This whipsaw action underscores the market’s recent instability.
Despite the S&P 500’s overall decline of more than 6% over the past three weeks, Friday’s 2.1% rally marks the third consecutive Friday of gains, raising hopes that the market’s recent downturn may be nearing an end.
Market participants are also keeping a keen eye on quarter-end portfolio adjustments.
Adding to the cautious outlook, Goldman Sachs economist David Kostin has revised his S&P 500 earnings per share (EPS) and valuation forecasts downward.
Kostin now projects a year-end index target of 6200, down from 6500, and EPS growth of 7%, a reduction from the previous 9%.
These revised forecasts sit below both consensus top-down and bottom-up estimates, reflecting a more conservative view on corporate earnings in the face of persistent economic uncertainties.
UBS has increased the probability of a combined downside scenario (stagflation or cyclical downturn) to 30%, reducing the probability of an upside scenario to 20%. The base case anticipates moderate but positive U.S. economic growth and is assigned a 50% probability.
Intraday Trading Pattern:
“Rolling Bear Market” Characteristics:
International vs. U.S. Markets:
Valuation Concerns:
Seriously, all this hand-wringing about a market crash? It’s way premature. We haven’t even sniffed a 10% drop in the last month, let alone anything truly catastrophic. And in the past five trading days? Not a single major index has even dipped more than 5%. That’s not a crash; that’s just a bit of volatility.
People keep throwing around this “crash” word like it’s a given. But let’s get real: Peter Mallouk from Creative Planning pointed out that the S&P 500 was down about 8% from its February peak. Historically, the average intra-year drop is closer to 14%. So, yeah, we’ve had a pullback, but a “crash”? We’re nowhere near that. All this panic is just noise.

Source: Creative Planning
What message will central banks send this week?
The week’s highlight will be the U.S. FOMC decision on monetary policy. Traders are not expecting any move on rates. However, with the Fed still smarting from underestimating inflation after the pandemic and non-farm payrolls pointing to resiliency in the job market, the markets think there’s a high bar to imminent US rate cuts.
We also get monetary policy decisions from the Bank of England (BoE) and the Bank of Japan (BoJ). The BoE is also expected to hold rates steady, having reduced its policy rate to 4.5% via a 25 basis point cut in February. While the Bank of Japan is also on hold, the next move is expected to be a hike amid signs of higher wage growth.

Source: CME Group Market Data
The Dollar’s “exorbitant privilege”—that enviable edge of being the world’s reserve currency, keeping borrowing costs low and demand steady—feels increasingly vulnerable. Markets are picking up on this, and it’s rippling through futures.
Last week, the DXY hovered around the 104 mark, struggling to regain its footing after a selloff that wiped out much of its gains from late 2024 into early 2025. It’s teetering near key support levels, with analysts suggesting a drop below 103 could signal further declines toward 100 or beyond.
The Dollar’s path has been uneven—ticking up slightly on Friday as government shutdown fears eased but still trending lower overall as tariff threats and policy chaos take center stage.

Source: TradingView
Bill Gross, the “Bond King,” straight up called tariffs “definitely bearish.” And he’s right. The problem isn’t just the tariffs themselves; it’s the sheer uncertainty. Nobody knows what’s coming next. Are we talking about short-term bluffs or long-term policy shifts? Which goods are hit, and when? The market hates this kind of guessing game.
Look, I get it. Trump likes to play hardball. And yeah, some of this is just negotiation tactics. But he’s also pretty clear about linking his success to the stock market. That means he’s not going to back down easily. This week’s metal tariff hikes, and the quick retaliation from Europe and Canada? That’s just the opening act. The rhetoric’s not letting up, and we’re likely heading for a full-blown trade war.
We currently have a 25% tariff on steel and aluminum, a 20% bump on Chinese imports, and some tariffs on Canadian and Mexican goods. This has raised the overall U.S. tariff rate by about 3%. It’s not great, but it’s not a total economic disaster, either. Businesses can adapt, and prices might tick up a bit.
But here’s the thing: The real issue is not the actual tariffs but the unknown. People wake up daily wondering what new tariff will drop, which spooks corporations and markets. The constant threat of negative surprises throws everything into chaos.
Gold just topped $3,000/oz for the first time, hitting an all-time high. Escalating tariff concerns fuel demand for safe-haven assets, and the specter of higher inflation, coupled with slowing economic growth, drives investors toward gold’s perceived stability.
Gold has been a star performer among major commodities this year, boasting a 14% year-to-date gain.
Consecutive record highs have been fueled by a potent mix of factors: trade tensions, aggressive central bank buying, and a notable increase in ETF holdings. Known gold ETF holdings have expanded by roughly 3.5 million ounces this year, reaching nearly 86.4 million ounces.
Central banks, which snapped up a massive 1,045 tonnes of gold last year, are expected to continue their buying spree, providing a significant tailwind for bullion prices.
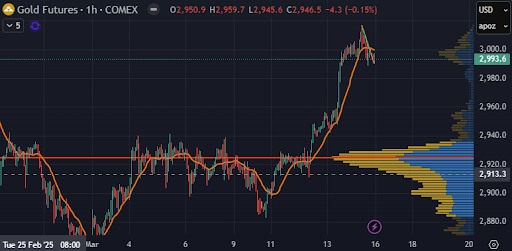
Source: TradingView
Recent weather patterns have definitely affected natural gas supply. We saw this clearly on Friday, when prices dipped to $4.00 and then bounced right back up. That $4.00 level looks like a solid support line for now.
Looking ahead, we could be seeing a potential long-term bottom form across the natural gas curve. The latest EIA report shows that the working gas in storage is at 1,698 billion cubic feet (Bcf) as of March 7th, a 62 Bcf drop from the previous week. To put this in perspective, we’re 628 Bcf below last year’s level and 230 Bcf below the five-year average of 1,928 Bcf.
Despite those declines, the storage level of 1,698 Bcf is still within the five-year historical range. So, while supply is definitely tighter than usual, it’s not completely out of whack.
Bitcoin took a hit this week, trading around $84,000 as a wave of tariff anxieties and recession worries triggered a broad crypto sell-off.
Significant ETF outflows underscore Bitcoin’s recent struggles. Twenty out of the last thirty trading days have seen net outflows, resulting in over 50,000 Bitcoins leaving ETFs within a rolling 30-day period.
The price drop saw Bitcoin fall below $80,000 at one time last week, and Ether hit its lowest point since October 2023. While a slight recovery has begun, fueled in part by a lower-than-expected CPI report, volatility remains.
Despite a more favorable regulatory landscape and discussions of a U.S. strategic Bitcoin reserve, Bitcoin has plummeted roughly 30% from its November peak above $109,000.
These performance charts track the daily, weekly, monthly, and yearly changes of various asset classes, including some of the most popular and liquid markets available to traders.


