Home › Market News › Big Tax Bill, Market Liquidity & Trade Management

The Economic Calendar:
MONDAY: Consumer Inflation Expectations (10:00a CT), Fed Barkin Speech (11:00a CT), Fed Waller Speech (12:00p CT), Fed Harker Speech (5:00p CT), Fed Bostic Speech (6:40p CT)
TUESDAY: Import/Export Prices (7:30a CT), NY Empire State Manufacturing Index (7:30a CT), Redbook (7:55a CT), Fed Barkin Speech (10:35a CT), NOPA Crush Report (11:00a CT), Fed Cook Speech (6:10p CT)
WEDNESDAY: MBA Mortgage Applications (6:00a CT), Retail Sales (7:30a CT), Industrial Production/Capacity Utilization (8:15a CT), Manufacturing Production (8:15a CT), Business Inventories (9:00a CT), NAHB Housing Market Index (9:00a CT), Retail Inventories (9:00a CT), EIA Petroleum Status Report (9:30a CT), Fed Hammack Speech (11:00a CT), 20-Year Bond Auction (12:00p CT), Fed Chair Powell Speech (12:30p CT), Foreign Bond Investment (3:00p CT), Overall Net Capital Flows (3:00p CT), Fed Schmid Speech (6:00p CT)
THURSDAY: Building Permits (7:30a CT), Continuing Jobless Claims (7:30a CT), Housing Starts (7:30a CT), Philly Fed Manufacturing Index (7:30a CT), EIA Natural Gas Report (9:30a CT), Fed Barr Speech (10:45a CT), Baker Hughes Rig Count (12:00p CT), Fed Balance Sheet (3:30p CT)
FRIDAY: EASTER HOLIDAY – U.S. MARKETS CLOSED
Key Events:
I don’t understand that adding $5.8 trillion over the next decade to the federal deficit is a “Beautiful Bill,” according to President Trump.
The House of Representatives narrowly passed a budget measure by a 216-214 vote, laying the groundwork for a sweeping legislative package to significantly reshape the nation’s fiscal landscape. The bill paves the way for a follow-on package that proposes substantial tax cuts, estimated at up to $5.3 trillion over the next decade, and a $5 trillion increase in the federal debt ceiling. These measures are contingent upon the implementation of deep spending cuts.
The budget measure faced significant opposition, with Republican Representatives Thomas Massie (KY) and Victoria Spartz (IN) joining Democrats in voting against it. The legislation also encountered resistance from a group of approximately 20 budget hawks and members of the House Freedom Caucus. These holdouts initially refused to support the Senate-amended budget resolution, demanding that the Senate commit to reducing spending by the House’s proposed $1.5 trillion over 10 years. This stood in stark contrast to the Senate’s initial proposal, which included a mere $4 billion in spending cuts.
The passage of this budget measure sets the stage for potentially contentious negotiations between the House and Senate as they work to reconcile their differing approaches to spending cuts.

Liquidity in two of the world’s most heavily traded macro futures contracts, the S&P 500 E-mini (ESM5) and the 10-Year Treasury Note (TYM5), has deteriorated significantly, raising concerns among market participants.
When order books are thin, a large sell order can quickly overwhelm the available bids, leading to a rapid price decline. This can trigger a cascade of stop-loss orders, further accelerating the downward or upward momentum.
According to JPMorgan market intelligence, the top-of-the-order-book bid-ask spreads for both contracts are approximately 80% wider than the 20-day market average.
This notable decline in liquidity coincides with an even more pronounced widening of bid-ask spreads in the 30-year U.S. Treasury Bond (UX1) futures contract, where the top-deck spread has worsened by roughly 95% compared to the 20-day average.
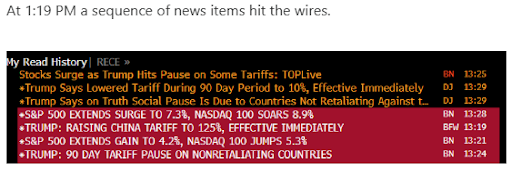
The most significant takeaway from recent market activity is the clear demonstration of the “executive put,” as President Trump’s unexpected 90-day pause on certain tariffs triggered a historic market surge. While many anticipated a policy-driven rally, the timing – occurring after the tariffs were initially imposed – surprised market participants.
The S&P 500 experienced its largest single-day gain since 2008 on Wednesday, fueled by short-covering, retail buying, and leveraged ETF activity. This dramatic intraday rebound, despite the exclusion of China from the tariff pause, resulted in record trading volume.

However, the rally occurred against a backdrop of lingering concerns about the potential impact of tariffs on the real economy, particularly as earnings season approaches. The S&P 500, closing at 20.2 times Wall Street’s consensus 2025 earnings estimate, remains richly valued. Sustaining positive returns from these levels requires the index to maintain its current earnings power through 2026, a scenario contingent on avoiding a recession.
Furthermore, some believe that traders will begin to discount near-term earnings results, particularly for technology companies like Microsoft, viewing the current quarter as a “mulligan” due to the tariff-induced uncertainty. The expectation is that deal closures will be pushed out, impacting revenue.
S&P 500 futures experienced an extraordinary surge on Wednesday, rallying approximately 400 points in a mere 15 minutes following President Trump’s announcement of a 90-day pause on tariffs for most countries.
The rally was characterized by an initial 100-point spike within milliseconds of the announcement, followed by a sustained upward trajectory that continued unabated until the closing bell.
Many protective buy stop limits were left unfilled as the market gapped higher. Example: You set a buy stop-limit order with a stop at $5100 and a limit at $5100. The market gaps or trades on one order at $5150. Your stop order is triggered at $5100, but then becomes a limit order to buy at $5100. Since the market is already at 5150, your order remains unfilled.
This rapid and dramatic price movement is a stark example of the market’s sensitivity to policy and news announcements. The event highlights a classic, albeit rare, market dynamic that can occur, and the risk of stop orders. While the rally proved profitable for those who capitalized on it, it also served as a valuable learning experience for traders who had stop orders not filled.
Soybean futures are trading higher, recovering from losses incurred following China’s recent announcement of tariff countermeasures. May 2025 soybean futures are up about 40 cents over the last week.
Technically, May beans have rallied through gap resistance, potentially offering a low-risk selling opportunity above for aggressive speculators. Near-term upside targets are seen at 1050 and 1066, and support at 1026, 1012, 998, and 979.
Trade news remains a significant factor influencing the soybean market. The E.U. has agreed to temporarily suspend countermeasures, potentially signaling a willingness to negotiate with the U.S.
China is reportedly actively purchasing South American soybeans, buying over 20 cargoes on one day and potentially up to 40 for the week. This activity suggests China is seeking alternative sources for soybeans, possibly in anticipation of or in response to trade tensions with the U.S.

Source: Bloomberg
The U.S. oil industry faces mounting pressure from a confluence of factors, including escalating trade tensions and a surprising production increase by OPEC+, driving crude prices to levels that threaten the viability of many domestic producers.
Oil executives report a 25% surge in casing and tubing costs due to tariffs, and widespread uncertainty hinders capital expenditure planning.
The Trump administration’s “Liberation Day” announcement of reciprocal tariffs triggered a sharp $12 selloff in Brent and WTI crude futures, briefly pushing prices to four-year lows—levels last seen during the pandemic. Despite a 90-day delay on some tariffs, the market damage was swift and significant.
The current WTI crude price of around $60 per barrel has fallen below the break-even point for many U.S. shale operators, including those in the Permian Basin. While some producers have hedged their output, a sustained period of low prices could lead to significant production cutbacks.
According to the Dallas Fed Energy Survey, U.S. oil producers need an average WTI crude price of $65 per barrel to remain profitable. Large firms, producing over 10,000 barrels per day, require at least $61 per barrel, while smaller firms need $66 per barrel. Therefore, the current price environment is putting significant strain on the U.S. energy sector.

Tariffs are taxes that:
Those are the first-order consequences.
Copper traders bet on China stimulus. Copper prices surged following Trump’s announcement of a 90-day tariff pause, but significant uncertainty remains over the long-term impact of tariffs on demand for pro-cyclical commodities like copper and other industrial metals.
Prior to the rebound, the downturn was fueled by escalating trade tensions, with US duties on Chinese goods rising to 145% and Beijing retaliating by capping its tariff at a 125% hike, calling Trump levies a “Joke”.
These aggressive measures threaten not only US–China trade relations but also increase domestic inflationary pressures in the US while damaging China’s export-driven economy, which is already grappling with weak domestic demand.
Fears that U.S. tariffs could extend to copper imports drove a sharp rise in New York futures last month, with prices at one point commanding a 15% premium over London. However, as the tariff war deepened and global recession fears mounted, copper prices reversed course—HG copper futures plunged 21%, partially due to a halving of that transatlantic premium.

Source: TradingView
It was a week of increasingly disorderly behavior in the U.S. government bond market, normally considered one of the safest investments, which should benefit during times of turmoil.
Instead, we saw a disorderly spike in long-end US Treasury yields, while global equity markets continued to fall, leaving investors with no safe options besides ultra-short-term bonds (t-bills).
A four-day 65 basis point jump in 10-year US Treasury notes briefly took the yield above 4.5%. While the actual rate was not the focus, it was the pace with which bond prices tumbled that made everyone take note, raising speculation that the move was driven by foreign selling pressure, focusing on China and Japan, and partly due to:
Whoever was selling, the message was clear: the selloff in risk assets pressured the White House into softening its tariff posture, at least temporarily. It also highlights just how reactive the current policy has become—and reinforces the need for everyone to stay nimble in the face of unpredictable decision-making.
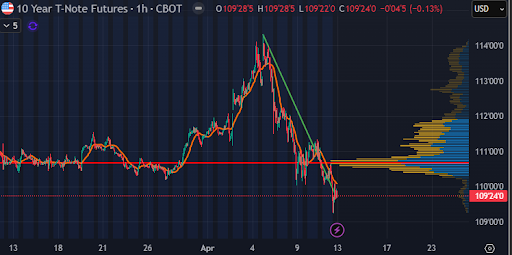
Source: TradingView


