Home › Market News › Energy Futures, British Inflation, and a Busy Eco Calendar
Along with the FOMC meeting and the release of new U.S. inflation data this week, we will also be keeping an eye on energy futures, British inflation data, and the busy eco calendar.
The Economic Calendar:
MONDAY: 6-Month Bill Auction, 3-Yr Note Auction, 3-Month Bill Auction, 10-Yr Note Auction, Treasury Statement
TUESDAY: FOMC Meeting Begins, NFIB Small Business Optimism Index, CPI, 52-Week Bill Auction, 30-Yr Bond Auction
WEDNESDAY: MBA Mortgage Applications, PPI, Atlanta Fed Business Inflation Expectations, EIA Petroleum Status Report, 4-Month Bill Auction, FOMC Announcement, Fed Chair Press Conference
THURSDAY: Jobless Claims, Philadelphia Fed Manufacturing Index, Retail Sales, Empire State Manufacturing Index, Import and Export Prices, Industrial Production, Business Inventories, EIA Natural Gas Report, 4-Week Bill Auction, 8-Week Bill Auction, Treasury International Capital, Fed Balance Sheet
FRIDAY: Quadruple Witching, Consumer Sentiment, Baker Hughes Rig Count
Futures Expiration and Rolls This Week:
Interest Rate futures roll from June (M) to September (U)
Key Events:
The S&P 500 exited bear market territory during the week by closing 20% above last year’s October lows and gained +0.4% for the week. The Nasdaq gained +0.1%.
Traders look forward to this week’s inflation data and policy decisions on interest rates from the U.S. Federal Reserve and the European Central Bank.
S&P 500 futures broke through the psychological 4,300 level, and now traders will use that level as key support.
The Fed is expected to pause interest rate hikes this Wednesday. Markets currently forecast a 71% probability that the Fed will pause rate hikes.
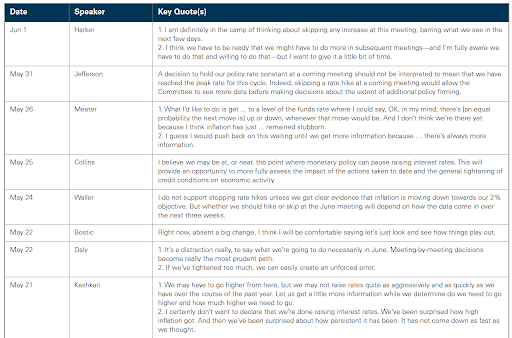
Here is what some of the FOMC members said ahead of the meeting:
U.S. Treasury yields compared to the last week:
30-Year yield 3.88% vs. 3.88%
10-Year yield 3.74% vs. 3.69%
5-Year yield 3.91% vs. 3.84%
2-Year yield 4.60% vs. 4.50%
2-10 Yield spread -0.85% vs. -0.90%

Traders are balancing a challenging economic picture against Saudi Arabia’s bullish supply cut.
In the latest sign that demand may be weaker than markets anticipated, the U.S. sees oil consumption rising at a more moderate pace than last year.
According to the Energy Information Administration’s monthly Short-Term Energy Outlook report, oil demand in the U.S. will grow by just under 1% in 2023 compared with 2% in 2022.
The drop in demand largely reflects a forecasted slump in diesel fuel usage.
The U.K. is set to have the highest inflation in the developed world. Meanwhile, housing prices posted their first annual drop since 2012.
The share of items in the CPI ‘basket’ rose by more than 5% this year, and now is expecting the inflation rate to be around 6.9% this year.
According to the OECD, lower confidence in the housing market and the increasing burden of public debt pose significant risks for the U.K. economy going forward.
The 24% rally in European gas prices last Tuesday was concerning.
We saw little-to-no change in European or global gas fundamentals. Traders are pointing to the heavy short positioning, causing a ‘short squeeze.’
While the move was largely pinned on OPEC’s decision to curtail crude production once again, oil moved less than 2% in response, well below the substantial natural gas move.
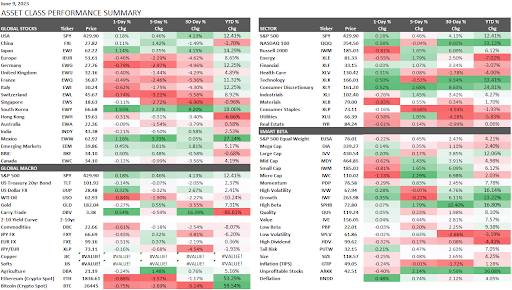
This performance chart tracks the daily, weekly, monthly, and yearly changes of various asset classes, including some of the most popular and liquid markets available to traders.

Traders should understand that we’re dealing with a very challenging and ‘split’ trading environment.
We suggest that it’s absolutely crucial that you make sure to be very disciplined! Don’t “overthink” things; stay vigilant with your risk management plan.
Despite all of the “cross-currents” and volatile moves that this market has presented, make sure to follow your trading plan.
