Home › Market News › FOMC, Jobs, and More Earnings
The Economic Calendar:
MONDAY: ISM Manufacturing PMI, Construction Spending, 3-Month Bill Auction, 6-Month Bill Auction
TUESDAY: Redbook, JOLTS, Factory Orders
WEDNESDAY: MBA Mortgage Applications, ADP employment, Federal Reserve interest-rate statement, Fed Chair Powell press conference
THURSDAY: Challenger Job Cuts, Initial Jobless Claims, EIA Natural Gas Report, 4-Week Bill Auction, 8-Week Bill Auction
FRIDAY: Unemployment Rate, Baker Hughes Rig Count
Futures Expiration and Rolls This Week:
There are no expiration or rolls this week
Key Events:
Stock indexes were higher on the week. The S&P 500 gained +0.90% for the week, and the Nasdaq index was up by +1.88%.
Traders are watching for most companies’ corporate share repurchase window to re-open this week.
Stock sector performance is seeing leadership in defensive names, despite stock indices trading near the top of the trading channel.
For April, Financials, Healthcare, Energies, and many of the defensive sectors, such as Utilities and Staples, did well. The sectors delivering lagging performance in April were Industrials and Materials.
A few key short-term levels for the S&P 500:
Upside: 4195, 4208,4220,4230,4265
Downside: 4130,4095,4080,4060
Fed pauses will unlikely lead to a sustained rally in Fed Fund futures markets. After a final 25 basis point hike at this week’s meeting, we expect the Fed to pause its current tightening stance.
The market is pricing a low probability of an additional hike at the June FOMC meeting but not dismissing it entirely. A 5-7 basis-point hike in June seems fair with the current known economic data.
The rates market is likely to hear a more cautious Fed. Fed is still data dependent, but the onus is now on data to disprove the “on hold” narrative.
The rates market will focus more on bank stress, this Friday’s payroll data, and the debt limit debate and outcome.
U.S. Treasury yields compared to the last newsletter:
30-Year yield 3.67% vs. 3.77%
10-Year yield 3.42% vs. 3.57%
5-Year yield 3.48% vs. 3.66%
2-Year yield 4.00% vs. 4.18%
2-10 Yield spread -0.58% vs. -0.61%
The market expectation is for the FOMC to raise Fed Funds futures rates by 25 basis points at Wednesday’s meeting. Then, the consensus is for the central bank to put the tightening policy on hold.
Fed Chair Powell will likely be questioned whether the central bank is paused. While some expect Powell to confirm that the hiking cycle has now run its course, he has previously deflected such questioning, reiterating that the Fed remains data-dependent in its policy approach.
Corporate earnings season has been better than expected.
64% of the S&P 500 by market cap has reported 1Q 2023 earnings, and results have surprised to the upside. 54% of firms have beaten consensus EPS expectations by more than a standard deviation of analyst estimates, well above the long-term average of 46%.
Both sales and margins exceeded expectations, and S&P 500 EPS growth is now tracking at -5% YoY, vs. a consensus estimate of -7% before the season.
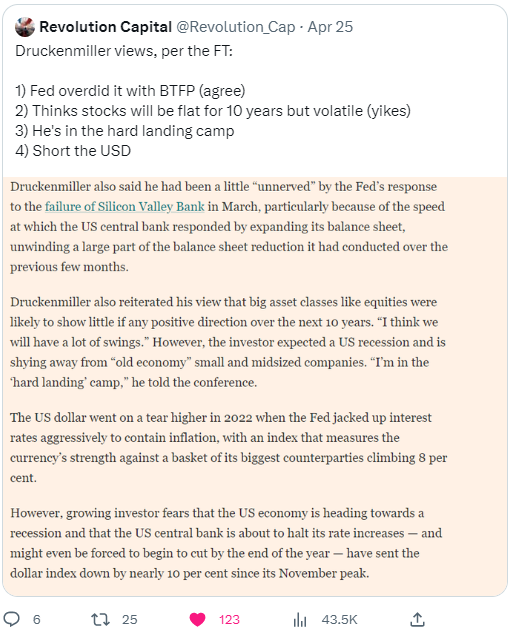
Our favorite macro hedge fund manager talks, and we listen. Short USD futures is becoming a crowded trade and would be a better seller on rallies.

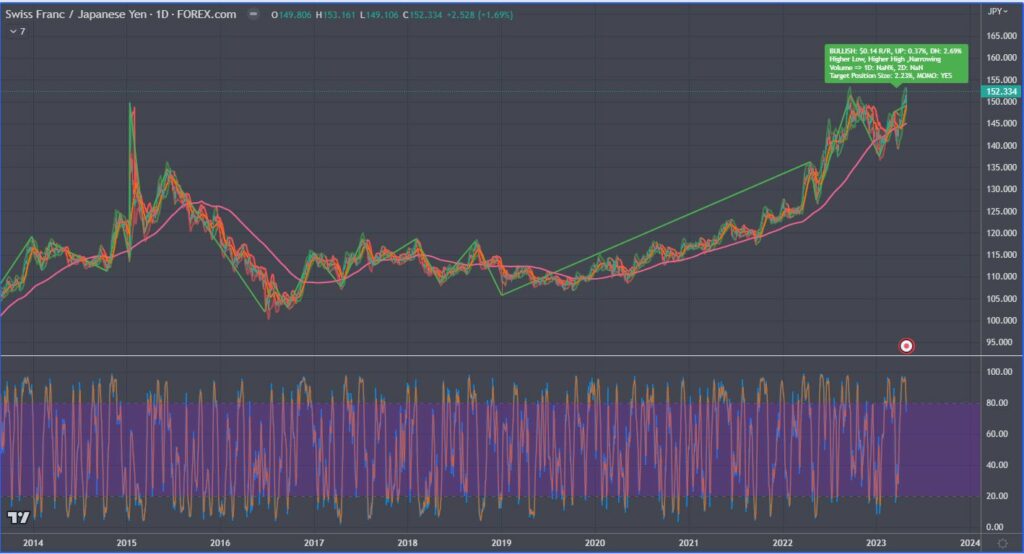
The Japanese yen futures vs. Swiss franc futures is the cheapest since January 1971. See the chart below.
If the BoJ ends the yield curve control (YCC) policy or starts getting more aggressive in fighting inflation, we could see a fast reversal in this trade.

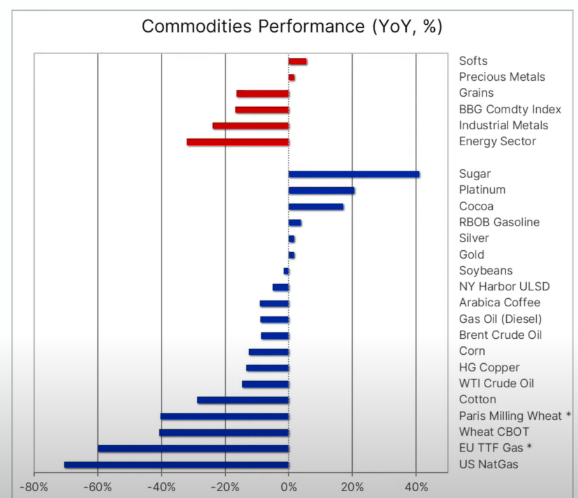
In Commodities, following a solid start to the year, copper prices have retreated on growing recession fears despite micro fundamentals continuing to strengthen on the back of rising Chinese demand.

Source: BofA
Crypto traders have been using Bitcoin (BTC) to hedge against the recent banking crisis. This narrative highlights multiple BTC core selling points, as the coin acts as a hedge on inflation or monetary mismanagement and eliminates counterparty risk via self-custody.
Bitcoin staged a rally this past week as First Republic Bank stock cratered to all-time lows and is expected to go into FDIC receivership.
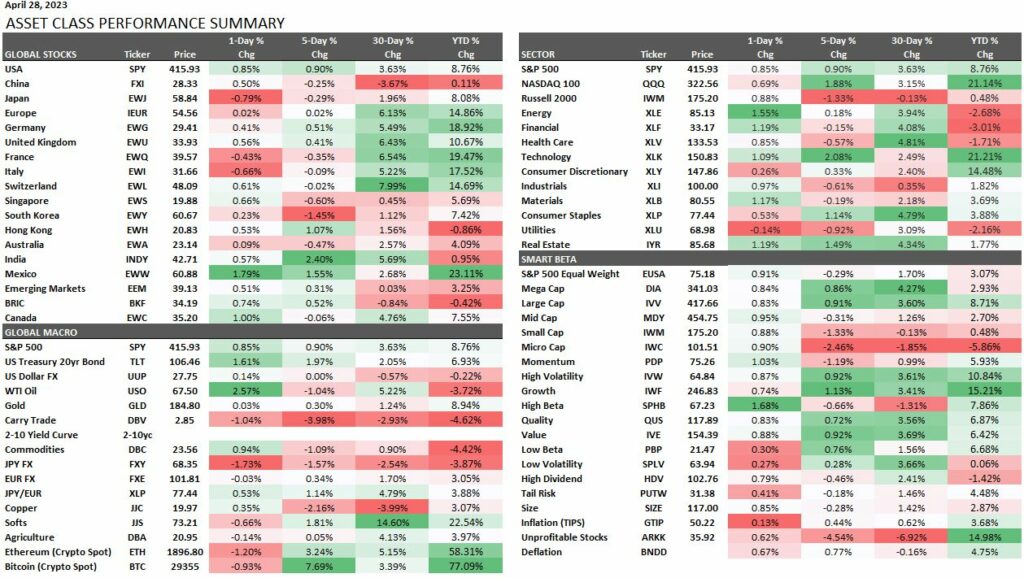
This performance chart tracks the daily, weekly, monthly, and yearly changes of various asset classes, including some of the most popular and liquid markets available to traders.

