Home › Market News › Grain Futures, Yen Futures, and a Look At This Week’s Eco Calendar

The Economic Calendar:
MONDAY: Dallas Fed Manufacturing Index (9:30a CT), Mary Daly Speaks (1:00p CT)
TUESDAY: Michelle Bowman Speaks (6:00a CT), Chicago Fed National Activity Index (7:30a CT), Redbook (7:55a CT), House Price Index (8:00a CT), S&P/Case-Shiller Home Price Index (8:00a CT), Consumer Confidence (9:00a CT), Richmond Fed Manufacturing Index (9:00a CT), Dallas Fed Services Index (9:30a CT), Lisa Cook Speaks (11:00a CT), 2-Year Note Auction (12:00p CT), Michelle Bowman Speaks (1:10p CT)
WEDNESDAY: MBA Mortgage Applications (6:00a CT), Building Permits (7:00a CT), New Home Sales (9:00a CT), EIA Petroleum Status Report (9:30a CT), 5-Year Note Auction (12:00p CT), Bank Stress Test Results (3:30p CT)
THURSDAY: Jobless Claims (5:00a CT), Corporate Profits (7:30a CT), Durable Goods (7:30a CT), GDP (7:30a CT), Consumer Spending (7:30a CT), Retail Inventories (7:30a CT), Wholesale Inventories (7:30a CT), Pending Home Sales (9:00a CT), EIA Natural Gas Report (9:30a CT), Kansas Fed Manufacturing Index (10:00a CT), 7-Year Note Auction (12:00p CT)
FRIDAY: Thomas Barkin Speaks (7:30a CT), Personal Consumption Expenditures (7:30a CT), Chicago PMI (8:45a CT), University of Michigan Consumer Sentiment (9:00a CT), Michelle Bowman Speaks (11:00a CT), Quarterly Grain Stocks (11:00a CT), Baker Hughes Rig Count (12:00p CT)
Key Events:
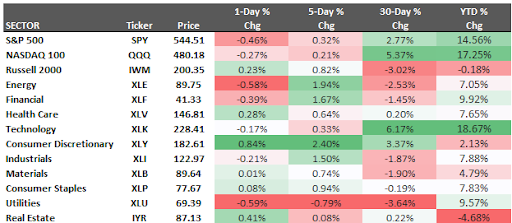
The S&P 500 and Nasdaq 100 were slightly up on the week, 0.32% and 0.21%, respectively. According to FactSet data, the S&P 500 enjoys a historic run, with no 2% decline in a record-breaking 377 days—the longest stretch since the 2008 financial crisis.
With stocks reaching new highs, the current market exuberance contrasts the Fed’s cautious stance. This disconnect could be attributed to the well-known principle – asset prices, particularly those denominated in dollars, tend to inflate to maintain their real value during inflationary periods.
Nvidia Corp. shares hit a snag last week, raising concerns about a potential domino effect on the broader market. The chipmaker’s stock price stall comes as catalysts like ETF rebalances and stock splits wane.
This market tranquility has been fueled by investor enthusiasm for megacap tech stocks, particularly those like Nvidia, which are at the forefront of artificial intelligence advancements. The S&P 500 is up over 14% year-to-date, propelled by this tech fervor and anticipation of Federal Reserve rate cuts. Recent data suggesting inflation is nearing the central bank’s 2% target has further bolstered the broad market index.
The central bank is taking a wait-and-see approach, prioritizing data and inflation control over immediate stimulus measures.
Traders have been laser-focused on the timing and frequency of potential Fed rate cuts. However, recent pronouncements by several Fed presidents and governors on Tuesday downplayed such expectations. The central bank seems less concerned about the exact number of cuts (one, two, or even four) and more focused on ensuring inflation remains controlled.
The most recent Federal Open Market Committee meeting saw policymakers maintain the current interest rate while their forecasts hinted at a more cautious approach to rate cuts than earlier projections.
![]()
This week, traders are focusing on the Fed’s favorite inflation gauge, PCE, and get a look at economic growth with GDP data.
![]()

Corn and soybean futures also experienced minor price declines last week. While a heatwave in the U.S. Midwest sparked initial concerns, agronomists downplayed its impact on crops at this stage. Additionally, traders noted the forecast for easing temperatures and upcoming showers in the region.
Wheat futures continued their downward trend, reaching two-month lows. This decline reflects a focus among traders on the following factors:

WTI and Brent crude oil prices have climbed to their highest levels since late April, reversing an earlier June decline.
Oil Market Drivers:
The Japanese Yen is experiencing a sustained depreciation against the U.S. dollar, driven by a stark contrast in monetary policies between the Federal Reserve and the Bank of Japan.
Since 2022, the Fed has embarked on interest rate hikes to combat rising inflation. Conversely, the Bank of Japan has maintained its ultra-loose policy, keeping interest rates near zero percent. This widening interest rate differential has significantly diminished the relative attractiveness of the Yen compared to the U.S. dollar.
The Yen’s weakness translates to higher import costs for Japanese consumers, potentially impacting their purchasing power.
Success in trading is not about every trade, and in tennis, it is not about every point.
Roger Federer will go down in history as one of the greatest tennis players ever and ONLY won 54% of his points, despite winning 80% of his matches.
You can be one of the best traders ever and WIN less than 50% of the time.
Perfection is impossible!!!
These performance charts track the daily, weekly, monthly, and yearly changes of various asset classes, including some of the most popular and liquid markets available to traders.