Home › Market News › Grains, Interest Rates, and Gold Futures

The Economic Calendar:
MONDAY: S&P Global Manufacturing PMI (8:45a CT), Construction Spending (9:00a CT), ISM Manufacturing Index (9:00a CT)
TUESDAY: Redbook (7:55a CT), Jerome Powell Speaks (8:00a CT), JOLTS (9:00a CT)
WEDNESDAY: EARLY CLOSE IN OBSERVANCE OF THE INDEPENDENCE DAY HOLIDAY (4TH OF JULY), John Williams Speaks (6:00a CT), MBA Mortgage Applications (6:00a CT), Challenger Job Cuts (6:30a CT), ADP Employment Change (7:15a CT), Balance of Trade (7:30a CT), Jobless Claimes (7:30a CT), Import/Export Prices (7:30a CT), S&P Global Composite PMI Final (8:45a CT), Factory Orders (9:00a CT), ISM Services Index (9:00a CT), Total Vehicle Sales (9:00a CT), EIA Petroleum Status Report (9:30a CT), EIA Natural Gas Report (11:00a CT), FOMC Minutes (1:00P CT)
THURSDAY: U.S. MARKETS CLOSED IN OBSERVANCE OF THE INDEPENDENCE DAY HOLIDAY
FRIDAY: John Williams Speaks (4:40a CT), Unemployment Rate (7:30a CT), Baker Hughes Rig Count (12:00p CT)
Key Events:
This Friday, estimates are for Non-Farm Payrolls (180k survey vs. 272k prior) and the Unemployment Rate (4.0% survey vs. 4.0% prior).
A higher unemployment rate would suggest that softening demand is easing pressures in the labor market; a lower unemployment rate would indicate that the slowing in immigration in recent months is tightening the labor market.

STOCK INDEX FUTURES
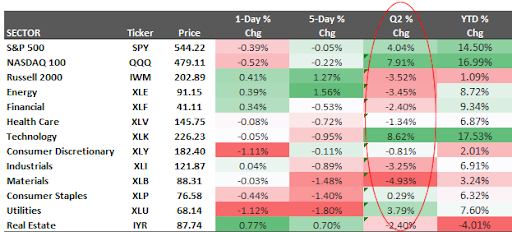
A tale of two markets emerged in Q2: a red-hot technology sector propelling the S&P 500 to new highs and a broad swathe of underperforming stocks. This divergence can be attributed mainly to a single theme – artificial intelligence (AI).
The S&P 500 market-weighted was higher by 4.40% for Q2. However, the broader Equal Weighted S&P 500 was only up 0.85%, and the even broader Russell 2000 was down 3.52%.
Sectors that outperformed in Q2:
Technology (XLK) had the strongest performance, with a Q2 change of 8.62%. Utilities (XLU) and Consumer Staples (XLP) also did well, with a Q2 change of 3.79% and 0.29%, respectively.
Sectors underperforming in Q2:
Energy (XLE) and Materials (XLB) were the worst performers, with a Q2 change of -3.45% and -4.93% respectively. Health Care (XLV) and Industrials (XLI) also underperformed in Q2 with a change of -1.34% and -3.25% respectively.
The market’s future trajectory remains uncertain. Some analysts see room for further gains, especially if second-quarter earnings meet expectations. Only three sectors—consumer staples, industrials, and materials—are forecast to report shrinking earnings, with seven anticipating growth exceeding 5%.
U.S. Treasury futures have been slow recently but broke below their recent trading channel on Friday.
This week, the FOMC Minutes will have an impact if they shine more light on what convinced FOMC members that progress on inflation has restarted and, second, to what extent FOMC members are considering the policy tradeoffs between inflation and growth.
Some participants changed their forecasts after the softer print, and some did not. Discussion of the CPI and SEP changes could give a better sense of the Fed’s reaction function.
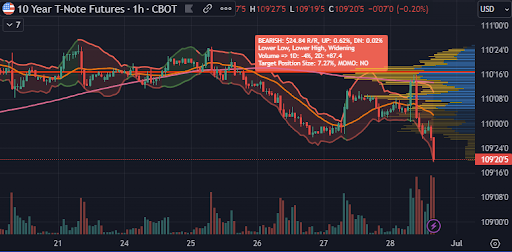
Source: TradingView
Corn futures plunged Friday after the U.S. Department of Agriculture (USDA) released its highly anticipated acreage report, revealing a larger-than-expected corn planting figure for 2024.
The USDA pegged corn plantings at 91.5 million acres, exceeding the agency’s prior estimate of 90.3 million from March and the broader market’s expectations. Analyst estimates hovered around 90.353 million acres, with trade guesses falling from 89.0 million to 91.3 million acres.
This unexpected increase in projected corn plantings sent shockwaves through the grain markets. Corn futures tumbled 5% in the immediate aftermath of the report’s release, reflecting concerns about a potential corn glut. While the USDA’s figure is still 3 million acres below final 2023 tallies, it suggests a larger-than-anticipated crop size could be on the horizon, potentially pressuring prices in the coming months.
The World Gold Council’s latest Central Bank Survey confirms that monetary authorities are looking to increase their gold purchases in the future.
The long-term store of value/inflation hedge, performance during times of crisis, effective portfolio diversifier, and no default risk all make gold attractive. (see graphic below)
While central banks’ motivations for owning gold may vary, they tend to have one thing in common: the share of USD in portfolios has been declining, and China’s holdings of U.S. treasuries dropped by $102bn in the past 12 months, while gold holdings have risen by $51bn, since Jan 2023.

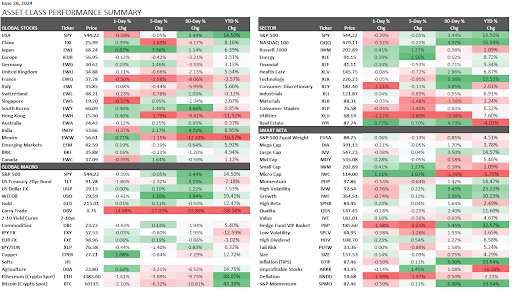
These performance charts track the daily, weekly, monthly, and yearly changes of various asset classes, including some of the most popular and liquid markets available to traders.