Home › Market News › Hog Futures, Rate Decisions, and the Fed Stress Test On Banks

The Economic Calendar:
MONDAY: Empire State Manufacturing Index (7:30a CT), NOPA Crush Report (11:00a CT), Patrick Harker Speaks (12:00p CT), Lisa Cook Speaks (8:00p CT)
TUESDAY: Retail Sales (7:30a CT), Redbook (7:55a CST), Industrial Production/Capacity Utilization (8:15a CT), Business Inventories (9:00a CT), Thomas Barkin Speaks (9:00a CT), Retail Inventories (9:00a CT), Susan Collins Speaks (10:40a CT), 20-Year Bond Auction (12:00p CT), Adriana Kugler Speaks (12:00p CT), Lorie Logan Speaks (12:00p CT), Alberto Musalem Speaks (12:20p CT), Austan Goolsbee Speaks (1:00p CT)
WEDNESDAY: U.S. MARKETS CLOSED FOR THE JUNETEENTH HOLIDAY
THURSDAY: MBA Mortgage Applications (6:00a CT), Building Permits (7:30a CT), Jobless Claims (7:30a CT), Housing Starts (7:30a CT), Philly Fed Manufacturing Index (7:30a CT), EIA Petroleum Status Report (9:30a CT), Thomas Barkin Speaks (3:00p CT)
FRIDAY: S&P Global Composite PMI Flash (8:45a CT), Existing Home Sales (9:00a CT), EIA Natural Gas Report (9:30a CT), Baker Hughes Rig Count (12:00p CT)
Key Events:
Stock indexes notched a weekly advance, primarily based on surprisingly soft inflation data. The S&P 500 was higher by +1.6%, and the Nasdaq 100 was up by +3.5%.
Largest market cap flip-flop. Jockeying for the #1 spot – Apple’s market value surged past Microsoft’s last Wednesday, making it the world’s most valuable company, as investors warmed to the iPhone maker’s push into artificial intelligence.
The table below shows the performance of various investment styles year-to-date (YTD).

The base case is that we will see an interest rate cut before the election. The Fed Fund futures forecast a slightly higher than 50% chance of a 25 basis point move lower in rates by September.
Recent inflation data and Fed comments see the Fed funds rate at a median of 5.1% at the end of 2024. This decreases the odds dramatically of the two rate cuts this year, and even the one rate cut is now questioned by some analysts.
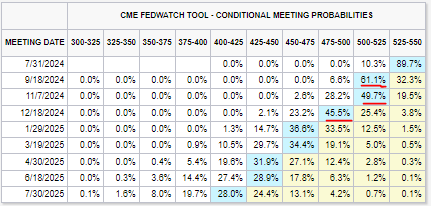
Source: CME Fedwatch
The most recent inflation outlook and Consumer Price Index number showed inflation rose 3.3% from a year earlier, a three-year low and slowing from April’s 3.4% rate.
The Fed expects core inflation to be 2.8% by year’s end, which is higher than its last inflation forecast of 2.6%. It projects that unemployment will stay at its current 4% rate by the end of this year and edge up to 4.2% by the end of 2025.
The report is due on Thursday. Expectations are for the BoE to hold the Base Rate at its current level of 5.25%, according to all 65 analysts surveyed by Reuters.
The upcoming Comprehensive Capital Analysis and Review (CCAR) by the Federal Reserve on June 26 is a stress-test regime for large U.S. banks. It aims to establish whether lenders have enough capital to cope with a severe economic shock and assesses their risk modeling practices.
Interestingly, options markets seem relatively calm despite the upcoming CCAR. The cost of 11-day straddles, a type of options contract that captures potential price swings around the event date, is trading at a significant discount compared to historical averages for similar CCAR events since 2021. For financial stocks, the average cost of these straddles sits at just 4.3%, implying a potential 17% upside compared to past CCAR periods.
This year, the Fed will also conduct a separate exploratory analysis along with the stress test to provide funding insights which our analysts believe is in direct response to the 2023 bank failures. Historically, banks have reported actual SCBs (Stress Capital Buffers) and provided incremental details on capital return plans following the CCAR results.
US Core Consumer Price Index — which excludes food and energy costs — climbed 0.2% from April, and the year-over-year measure rose 3.4%, cooling to the slowest pace in more than three years. U.S. treasuries and stocks jumped higher on the news as traders fully priced in two rate cuts from the Fed this year.

While seasonality typically dictates a price uptrend for hogs in the current period, the chart paints a concerning picture. July Hogs have shed a significant $19 per hundredweight (cwt) since early April, plunging from $111 to $92.
This unexpected downturn can be attributed to factors dampening export demand, a critical driver for the U.S. hog industry. Firstly, China, a historically robust pork importer, has halted significant purchases from the U.S. market. Secondly, the recent devaluation of the Mexican peso has discouraged imports from south of the border. This export weakness has resulted in a market oversupplied with pork, putting downward pressure on prices.
Despite these headwinds, technical indicators suggest the market may be oversold, potentially priming it for a correction. However, a sustained price rally hinges on a fundamental shift – a critical need for the resumption of robust foreign trade. A significant increase in export activity, particularly to China or other major markets, would be a welcome catalyst for the struggling hog market.
However, a glimmer of hope emerged last week as lean hog futures bulls finally found some footing after hitting or getting close to new contract lows on Friday. Most contracts were up anywhere from 15 cents to $1.85, as expiring June was down 57 cents. This short-term uptick suggests potential price correction, but whether it translates into a sustained rally depends heavily on addressing the underlying export issues.

Source: Tradingview
These performance charts track the daily, weekly, monthly, and yearly changes of various asset classes, including some of the most popular and liquid markets available to traders.