Home › Market News › Jobs Report Breakdown, Bitcoin Break, and This Weeks Key Events

The Economic Calendar:
MONDAY: Used Car Prices (8:00a CT), Total Vehicle Sales (9:00a CT), Wholesale Inventories (9:00a CT), Consumer Inflation Expectations (10:00a CT), Consumer Credit Change (2:00p CT)
TUESDAY: NFIB Business Optimism Inex (5:00a CT), Redbook (7:55a CT)
WEDNESDAY: MBA Mortgage Applications (6:00a CT), CPI (7:30a CT), Core Inflation Rate (7:30a CT), EIA Petroleum Status Report (9:30a CT), 10-Year Note Auction (12:00p CT)
THURSDAY: Jobless Claims (7:30a CT), PPI (7:30a CT), EIA Natural Gas Report (9:30a CT), WASDE Report (11:00a CT), 30-Year Bond Auction (12:00p CT), Monthly Budget Statement (1:00p CT), Fed Balance Sheet (3:30p CT)
FRIDAY: Import/Export Prices (7:30a CT), University of Michigan Consumer Sentiment (9:00a CT), Baker Hughes Rig Count (12:00p CT)
Key Events:
This week’s consumer inflation report will likely determine whether the Fed cuts its benchmark lending rate by 25 or 50 basis points.

The ongoing economic concerns surrounding the labor market and the potential for a recession have led to heightened activity in the options market.
Volatility has remained elevated, indicating a strong demand for downside protection in stock index options and upside protection in VIX options.
This demand has been evident in the buying of large VIX call spreads. These actions suggest a potential for a broader range of outcomes in the future, as market makers are short these positions and need to hedge.
In recent weeks, continued upward pressure on the VIX led to the purchase of a substantial amount of vVol, which could contribute to further market stress.
Specific trade examples include:
We don’t think the Jobs report was enough for a 50 basis points rate decrease.
The headline figures weren’t bad enough to make 50 the base case, but in light of the revisions, they weren’t good enough to convincingly douse speculation on a larger cut.
There was a chance the jobs report would provide an obvious signal on the size of the first cut, and futures-market pricing would move to 90% right away for either 25 or 50. We are now at 30%(50bp) and 70%(25bp).
Instead, this report does not neatly resolve the question, and all eyes are now on the CPI report this week.
The stock market suffered a severe downturn this week, with the tech-heavy Nasdaq experiencing its worst week in nearly three years, dropping -5.79%. The S&P 500 also dipped by -4.14%. This decline was triggered by concerns about the economy, particularly after manufacturing data was released that indicated continued weakness.
The prospect of interest rate cuts has gained momentum, with traders eagerly awaiting Tuesday’s CPI report for further clues.
While the jobs report was mixed, with fewer jobs added than expected but a lower unemployment rate, it did suggest a more robust labor market than in previous months. Additionally, the government revised its estimates downward for June and July job growth.
Historically, small-cap stocks have performed well, especially when valuations are low. Given their current valuation, small-caps may benefit from the current market conditions.
The futures market is now projecting a 30% chance of a 0.50% Federal Reserve rate cut in September. This expectation shift is reflected in the decline of two-year Treasury yields to 3.65%, the lowest level in 16 months.
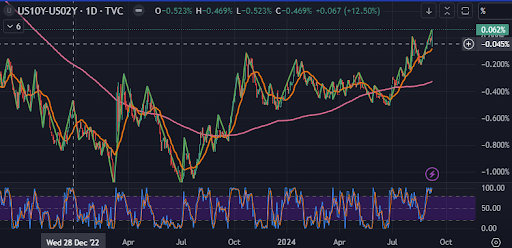
The widening gap between two-year Treasury yields and the Fed’s policy rate suggests that the market believes the Fed may be slow to respond to weakening employment data. This spread has reached its widest point since 1981.
The inversion of the 2-to-10-year Treasury yield curve, a historical recession indicator, has narrowed significantly. While this traditional signal has been unreliable in recent economic cycles, it still carries weight.
Federal Reserve officials have emphasized the importance of maintaining a healthy labor market. San Francisco Fed President Mary Daly and Atlanta Fed President Raphael Bostic have expressed concerns about over-tightening monetary policy and balancing inflation reduction with maximum employment.
While these developments may unsettle the stock market, the Atlanta Fed’s GDPNow growth model indicates continued economic growth. Service sector surveys for August will provide further insights into economic activity.

Source: CME Fedwatch
We expect the ECB to cut 25 basis points to 3.50% this Thursday.
This confirms that June was not a one-off insurance cut, and the ECB is in the dialing back restrictiveness phase of the cycle. The question is not whether the ECB cuts in September but what the ECB says about the next steps in the easing cycle.
The ECB has been reticent about its guidance and will likely remain so in September.
These employment numbers should be “good enough.”

The crude oil market experienced a significant shift in supply the week ending August 30th. Crude stockpiles declined by 6.9 million barrels, bringing the total to 418.3 million.
Despite this tightening supply, oil prices continued to fall, reaching a new yearly low. The market’s pessimism about the global economy seems to overshadow concerns about supply shortages.
The recent price drop, driven by the headline about OPEC’s decision to maintain production cuts, reflects the market’s perception of weaker-than-expected global demand. However, the delicate balance between supply and demand could easily tip the market into a major deficit, especially given the uncertainty surrounding Libyan oil production and the current state of U.S. oil supplies.

Bitcoin prices experienced a sharp decline on Friday, dropping nearly 5.7% and 10.49% for the week.
Several bearish factors, including disappointing job data, influenced this downturn. The cryptocurrency fell to a low of around $52,530 but is trading at $54,700 as of this writing.
A daily close below $55,000 could lead to further price declines in the coming days. Losing this support level might trigger a retest of the $52,100 level, which is the current realized price of short-term holders.
The price range between $50,500 and $53,000 is significant due to the large whale accumulations in February 2024.

These performance charts track the daily, weekly, monthly, and yearly changes of various asset classes, including some of the most popular and liquid markets available to traders.