Home › Market News › New Year and a Fresh Start for Trading!
The Economic Calendar:
MONDAY: US Holiday: New Year’s Day Observed (Markets Closed)
TUESDAY: PMI Manufacturing, Construction Spending, 3-Month Bill Auction, 6-Month Bill Auction
WEDNESDAY: Motor Vehicle Sales, MBA Mortgage Applications, ISM Manufacturing Index, JOLTS, 4-Month Bill Auction, FOMC Minutes
THURSDAY: Challenger Job-Cut Report, ADP Employment Report, International Trade in Goods and Services, Jobless Claims, Raphael Bostic Speaks, PMI Composite Final, EIA Natural Gas Report, EIA Petroleum Status Report, 4-Week Bill Auction, 8-Week Bill Auction, James Bullard Speaks, Fed Balance Sheet
FRIDAY: Employment Situation, Factory Orders, ISM Services Index, Raphael Bostic Speaks, Thomas Barkin Speaks, Baker Hughes Rig Count
Futures Expiration and Rolls This Week:
There are no expiration or rolls this week
What To Watch This Week

The commodity boom is taking a pause, not ending. Watch for the commodity boom to continue in 2023.
Crude Oil has fallen from a peak of more than $125 a barrel in early 2022 to about $80 a barrel, but the price remains well above the bottom set in December 2008 at around $35 a barrel. The same pullback applies to other commodities, from copper to corn and wheat.
On the bearish side, the economic slowdown is already showing signs of dampening commodity demand. Global Central Banks are all slamming the brakes via higher interest rates.
On the bull side, many microeconomic factors, such as low inventories and limited capacity, will keep prices higher in 2023 than during past recessions.
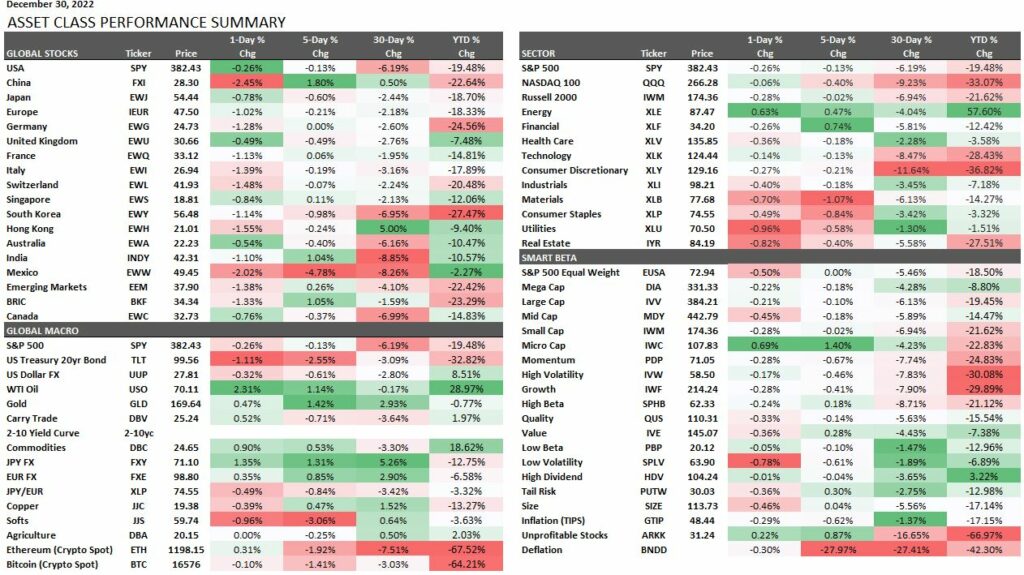
It’s reflection time as we close out 2022. U.S. stock traders saw some of their biggest losses since the 2008 Financial Crisis. The S&P 500 finished the year -19.5% lower, small caps (as represented by the Russell 2000) ended lower by nearly -21%, and the Nasdaq 100 lost -33.07% of its value.
Last year turned many of the stock markets former darlings into duds. For the better part of the previous decade, traders crowded into fast-growing technology companies, and that trend reversed in 2022.
Some of the bearish arguments we are following to start the year are:
FOMC continues to hike short-term interest rates, although increases have slowed
Will inflation keep falling back to the 2% growth level?
Geopolitical concerns
Supply disruptions
Recession worries
Public company earnings lower than forecasts
This week, the FOMC minutes are released, and we look at what Fed officials are thinking. The consensus is for a continued rise in the Fed Funds rate but at a slower pace to combat inflation.
Traders are looking for any aggressive language by the Fed. Traders should pay attention to possible volatility and properly sizing trades.
Rates in 30-year bonds and 10-year notes have increased over the last two weeks since the most recent FOMC decision.
Goldman Sachs says the central bank hiking cycles are likely to pause sometime next year and looks for 10-year U.S. Treasury yields to peak at 4.50% in 1H23 before trending a tad lower into year-end 2023 to 4.30%.
U.S. Treasury yields current yield compared to the last newsletter:
30-Year yield 3.975% vs. 3.56%
10-Year yield 3.88% vs. 3.58%
5-Year yield 4.0% vs. 3.77%
2-Year yield 4.42% vs. 4.35%
2-10 Yield spread -0.54% vs. -0.76%
Oil traders are monitoring Covid cases again. We are looking for higher crude oil prices in 2023, but the significant risk is another global Covid wave.
As China reopens its economy, some think that the Covid risk could be overshadowed by bullish supply data from the American Petroleum Institute and the fact that we are at the end of Biden’s record-breaking 180-million-barrel Strategic Petroleum Reserve release.
The API reported that crude supplies fell by 1.3 million barrels. After almost 180 million barrels were released from the SPR, U.S. commercial inventories are still about -7% below average, and the SPR barrels are at the lowest level since December 1983.
The most disappointing token in 2022 was Solana which was valued at $52bn on January 1, 2022, and is now valued at just $3.3bn.
The Solana token dropped quickly in value as it was tied to the collapse of one of its most prominent supporters, FTX CEO Sam Bankman-Fried.
Some traders still believe in the project based on their best-in-class developer community. They also point out that SOL’s 2021-2022 chart mimics the boom-bust pattern set by ETH in 2018 and 2019 when ETH fell 95% from its heights above $1,200. ETH weathered another boom-bust cycle and has settled in the $1,200 range again.


