Home › Market News › Q3 Earnings, VIX Futures, and a New Position Sentiment Report

The Economic Calendar:
MONDAY: US HOLIDAY: Columbus Day / Indigenous Peoples Day (Banks & Bond Markets Closed; NYSE is OPEN)
TUESDAY: NFIB Small Business Optimism Index, Raphael Bostic Speaks, Wholesale Inventories, 3-Month Bill Auction, 6-Month Bill Auction, 3-Yr Note Auction, Neel Kashkari Speaks, Mary Daly Speaks
WEDNESDAY: MBA Mortgage Applications, PPI-Final, Atlanta Fed Business Inflation Expectations, 4-Month Bill Auction, Raphael Bostic Speaks, 10-Yr Note Auction, FOMC Minutes
THURSDAY: CPI, Jobless Claims, EIA Natural Gas Report, EIA Petroleum Status Report, 4-Week Bill Auction, 8-Week Bill Auction, Raphael Bostic Speaks, 30-Yr Bond Auction, Treasury Statement, Fed Balance Sheet
FRIDAY: Import and Export Prices, Patrick Harker Speaks, Consumer Sentiment, Baker Hughes Rig Count
Key Events:
The stock market witnessed a knee-jerk reaction early Friday morning as stocks declined and yields reached yearly highs. This reaction was triggered by a robust jobs report, which raised the possibility of another interest rate hike before the year’s end. However, upon closer examination of the report’s details, stocks rebounded and closed the day in positive territory.
The S&P 500 ended the week +0.37%, and the Nasdaq 100 was higher by +1.65%.
The report indicated that job security and the potential for increased income continue to support economic growth. Furthermore, the substantial job creation rate observed has yet to translate into a significant surge in wage growth.
Another positive factor influencing investor sentiment was the absence of any expansion in strikes by the United Auto Workers against automakers during the week, indicating progress in ongoing negotiations.
The robustness of the job market continues to be a noteworthy factor in the economic landscape. Our analysis considers the Federal Reserve’s clear indication of maintaining elevated interest rates for an extended period, which has already started to manifest itself in the mortgage market, with some borrowers experiencing rates nearing 8%.
As the job market dynamics evolve, the Fed might ease its stance on interest rates, resulting in a potential decline in mortgage rates.
After the jobs report, futures traders raised the probability of the Fed hiking rates in November to 29.2%, up from 23.7% before the data’s release, according to CME Group’s FedWatch Tool.
Jeff Gundlach, Chief Executive Officer of DoubleLine Capital, underscores the challenges posed by the Federal Reserve’s “higher for longer” stance on interest rates. He points out that the equity market has already discerned this trajectory, and the uptick in bond yields only exacerbates the situation. Gundlach shared his insights during an event hosted by the investment manager in New York City.
This is further evident in the surge of U.S. Treasury yields for 10-year notes, which reached 4.80% on October 3, a notable increase from 4.09% at the end of August and 3.82% at the end of June.
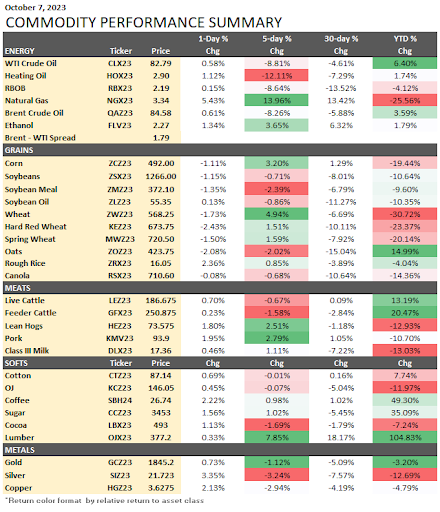
Oil prices continue to face downward pressure.
In commodity analysis, Saudi Arabia and Russia have recently reaffirmed their commitment to maintaining oil supply constraints. Saudi Arabia has formally declared its intention to persist with a voluntary reduction of 1.0 million barrels daily until the end of December. Concurrently, Russian Deputy Prime Minister Alexander Novak has articulated Russia’s commitment to sustaining an additional voluntary supply reduction of 300,000 barrels per day until the end of December 2023.
Should these measures propel prices beyond the $100 per barrel threshold, discussions might ensue regarding Saudi Arabia’s possible intervention to prevent an excessive surge in the market.
During the recent meeting of OPEC+ ministers, which took place last Wednesday, no modifications were made to the group’s oil output policy. However, shortly after this announcement, crude oil prices experienced a sharp decline of over $5 per barrel. This downturn can be attributed to data indicating a substantial increase in U.S. gasoline inventories, which exceeded expectations.
Traders prepare for a key CPI inflation report on Thursday. Any upward surprises, especially in core prices, may lead traders to anticipate a more hawkish stance from the Fed. Conversely, if the data falls below consensus expectations, it could encourage markets to continue pricing future interest rates more dovish than the Fed’s current dot plot indicates.

Source: TradingEconomics
The S&P 500 companies are gearing up to start reporting their third-quarter results in the coming week. The consensus among analysts anticipates a 2% increase in sales, a 55 basis point decrease in profit margins to 11.2%, and earnings per share (EPS) to remain flat compared to the previous year. If we exclude the Energy sector, earnings for the S&P 500 are projected to grow by 5%.
It’s worth noting that short positions on bank stocks have surged again, surpassing the post-collapse levels seen after Silicon Valley BanKs (SVB) decline in March.
This increase in short interest is occurring against the backdrop of concerns surrounding the banking sector in the United States and globally.
Several factors are attributed to this surge in short interest. One prominent factor is the decline in bond markets, which has put added pressure on banks. This decline in bond values is driven by growing expectations that the Federal Reserve will maintain elevated interest rates for an extended period. This threatens banks holding loans and fixed-income securities issued during historically low interest rates.
The CBOE Volatility Index futures (VIX) is a real-time indicator of market sentiment, reflecting expectations of market volatility for the upcoming 30 days. It is a valuable tool for traders in evaluating risk, gauging fear, and assessing stress levels when trading.
Recently, there has been a notable increase in the VIX, with a 22% rise over the past month. This uptick suggests an expected rise in market volatility over the next 30 days.
Following such upswings, the VIX has typically experienced a median decrease of approximately 20% over the subsequent six months. However, it’s essential to acknowledge exceptions to this pattern, such as the extraordinary surge in June 2008 when the VIX skyrocketed by 92% in the aftermath of a significant event.
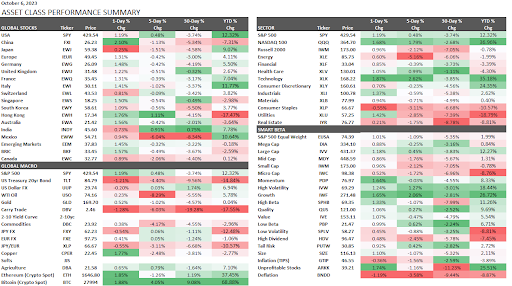
These performance charts track the daily, weekly, monthly, and yearly changes of various asset classes, including some of the most popular and liquid markets available to traders.


After adjusting to life without student loans, payments restarting on October 1 will bring hard choices for some borrowers.

