Home › Market News › Stock Futures, Interest Rates, and a Look At Chinese Stimulus

The Economic Calendar:
MONDAY: Dallas Fed Manufacturing Index (9:30a CST)
TUESDAY: Redbook (7:55a CST), Housing Price Index (7:00a CST), Consumer Confidence (9:00a CST) JOLTS (9:00a CST), 2-Day Fed Meeting Begins
WEDNESDAY: MBA Morgage Applications (6:00a CST), ADP Employment Report (7:15a CST), Employment Cost Index (7:30a CST), Chicago PMI (8:45a CST), EIA Petroleum Status Report (9:30a CST), Interest Rate Decision (1:00p CST), Fed Chairman Press Conference (1:30p CST)
THURSDAY: Challenger Job Cuts (6:30a CST), Jobless Claims (7:30a CST), Manufacturing PMI (8:45a CST), Construction Spending (9:00a CST), ISM Manufacturing Index (9:00a CST), EIA Natural Gas Report (9:30a CST)
FRIDAY: Unemployment Rate (7:30a CST), Factory Orders (9:00a CST), Consumer Sentiment (9:00a CST), Baker Hughes Rig Count (12:00p CST)
Key Events:
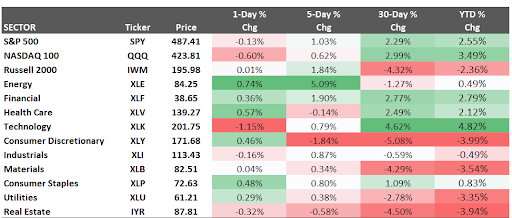
Stocks closed mixed but stayed positive for the week as the latest PCE and GDP data added to investor optimism about the U.S. economy. For the week, the S&P 500 finished 1.1% higher, the Nasdaq Composite gained 0.9%, and the Dow Jones Industrials added 0.7%.
The core personal consumption expenditures (PCE) price index – the Federal Reserve’s preferred inflation gauge – rose 0.2% M/M in December 2023.
We saw a few corporate earnings warning signs for the market, as electric automaker Tesla’s latest sales warning saw it depart the ‘Magnificent Seven’ of mega-cap stock leaders – shedding 12% and some $80 billion in market cap on Thursday.
Chipmaker Intel was another outlier, plunging 10% on Friday after forecasting revenue for the first quarter that could miss market estimates by more than $2 billion.

The Federal Reserve is largely expected to hold its interest rate decision steady and make only subtle changes to the policy. But, Fed Chair Jerome Powell’s press conference will be closely watched for any hawkish or dovish messaging.
The ongoing debate to cut rates is the dominant narrative. The question traders are speculating on is, “How Many Rate Cuts?”
We think the Fed will discuss extensively the merits of cutting interest rates against the risk of future inflation, which has yet to fall to the 2.0% target.
Traders expect the Fed will cut rates in late spring or summer because inflation has declined much faster than the central bank anticipated. Core inflation in the fourth quarter came in significantly lower than they expected just last June.
The Fed’s preferred inflation measure, the personal consumption expenditures price index, rose 0.2% in December from the previous month, the Commerce Department said Friday. That was up from a 0.1% decline in November but still consistent with subdued inflation.
Chinese authorities are looking to revive confidence and stem a stock market selloff that has sent the benchmark CSI 300 Index to a near five-year low to start 2024.
The Chinese authorities are said to be weighing a $278 billion rescue package.
Analysts and macro traders remain skeptical, warning that while the package might offer short-term market relief, lasting sentiment recovery needs more strategic, long-term measures.
So far, the market’s response has been lukewarm. Many traders await robust investor protections and reforms before committing additional investment capital.
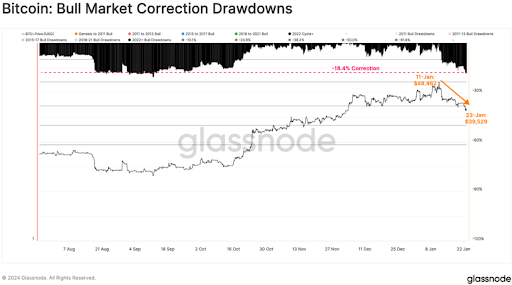
For the last week, the price of bitcoin has been trading in a tight range between 38,000 and 42,000.
Crypto investors had hoped the new spot bitcoin ETFs would attract new assets to the market and boost the price of the largest cryptocurrency. Instead, the token’s price has fallen more than 10% since the Securities and Exchange Commission approved the new class of funds earlier this month.
Many professional traders also expect that Bitcoin volatility will decline with the ETF listing, especially once we see an active derivatives market built on top of those ETFs.
Traders should continue to use the current high implied volatility levels and sell options.

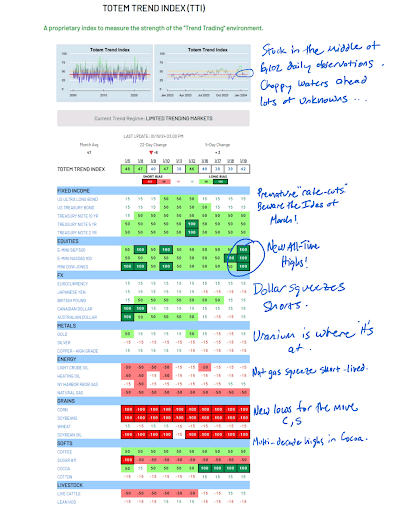
an excellent overview of the state of trend followers from Andy Strassman at Totem Asset Management.

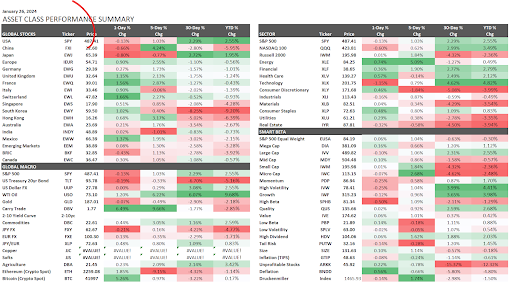
These performance charts track the daily, weekly, monthly, and yearly changes of various asset classes, including some of the most popular and liquid markets available to traders.

