Home › Market News › Topstep Trading 101: Triangles (Part 2)
The purpose of this series is to educate you on the basic techniques and principles of technical analysis. To a lot of you, this is old news, but for the rest of you, we are here to help you build a solid foundation for reading chart patterns.
In part 1 of this series we went over the technical approach to trading symmetrical triangles. Today we will concentrate on ascending and descending triangles (A&D). While much of what we’re going to say is very similar to the symmetrical triangle, A&D triangles have a unique trait. No matter where you are in the progression of a trend, an ascending triangle is alway bullish, and a descending triangle is always bearish. Don’t forget that part, it’s very important.
Ascending Triangle
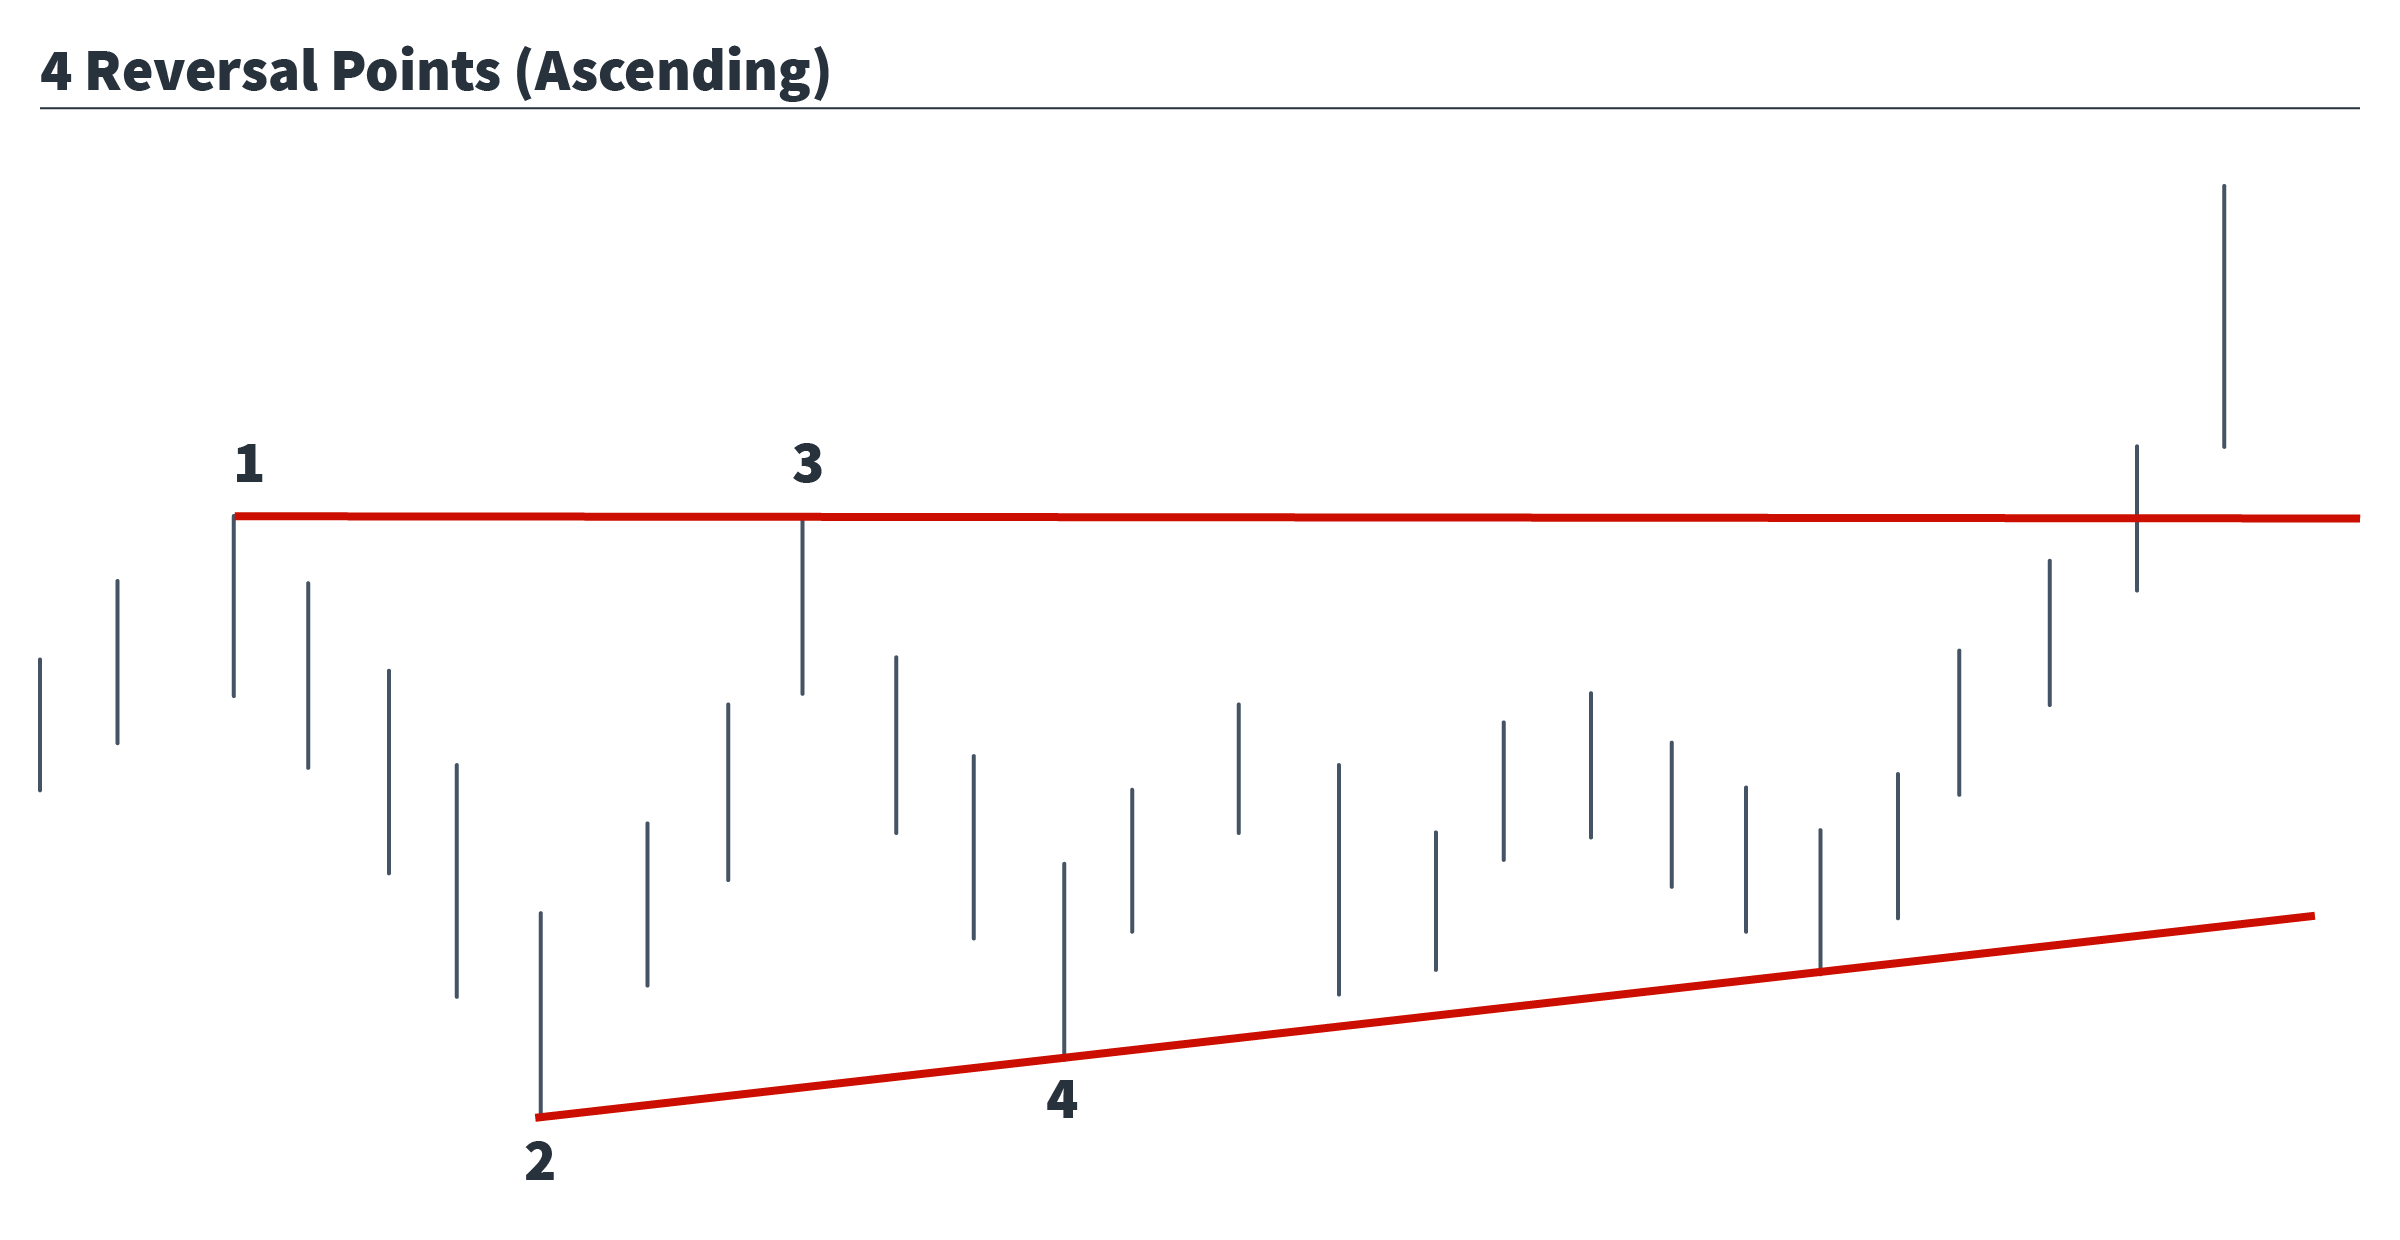
The ascending triangle is a bullish chart pattern consisting of 2 trendlines converging towards an apex. In an ascending triangle, the top line is horizontal, representing a typical resistance area, while the bottom line ascends upwards, showing a series of higher lows. There must be a minimum of 4 reversal points in order for this to be considered a triangle pattern.

As price begins to consolidate and move towards the apex, the first thing you should notice is a significant decrease in volume as uncertainty increases. A breakout occurs when the resistance level is breached, and confirmed with a price bar closing outside of the triangle on increased volume.
False breakouts are very common with this setup, as weak longs are generally tested with a run at downside stops before the upside breakout is confirmed, so trade entry and proper risk management are also key components.
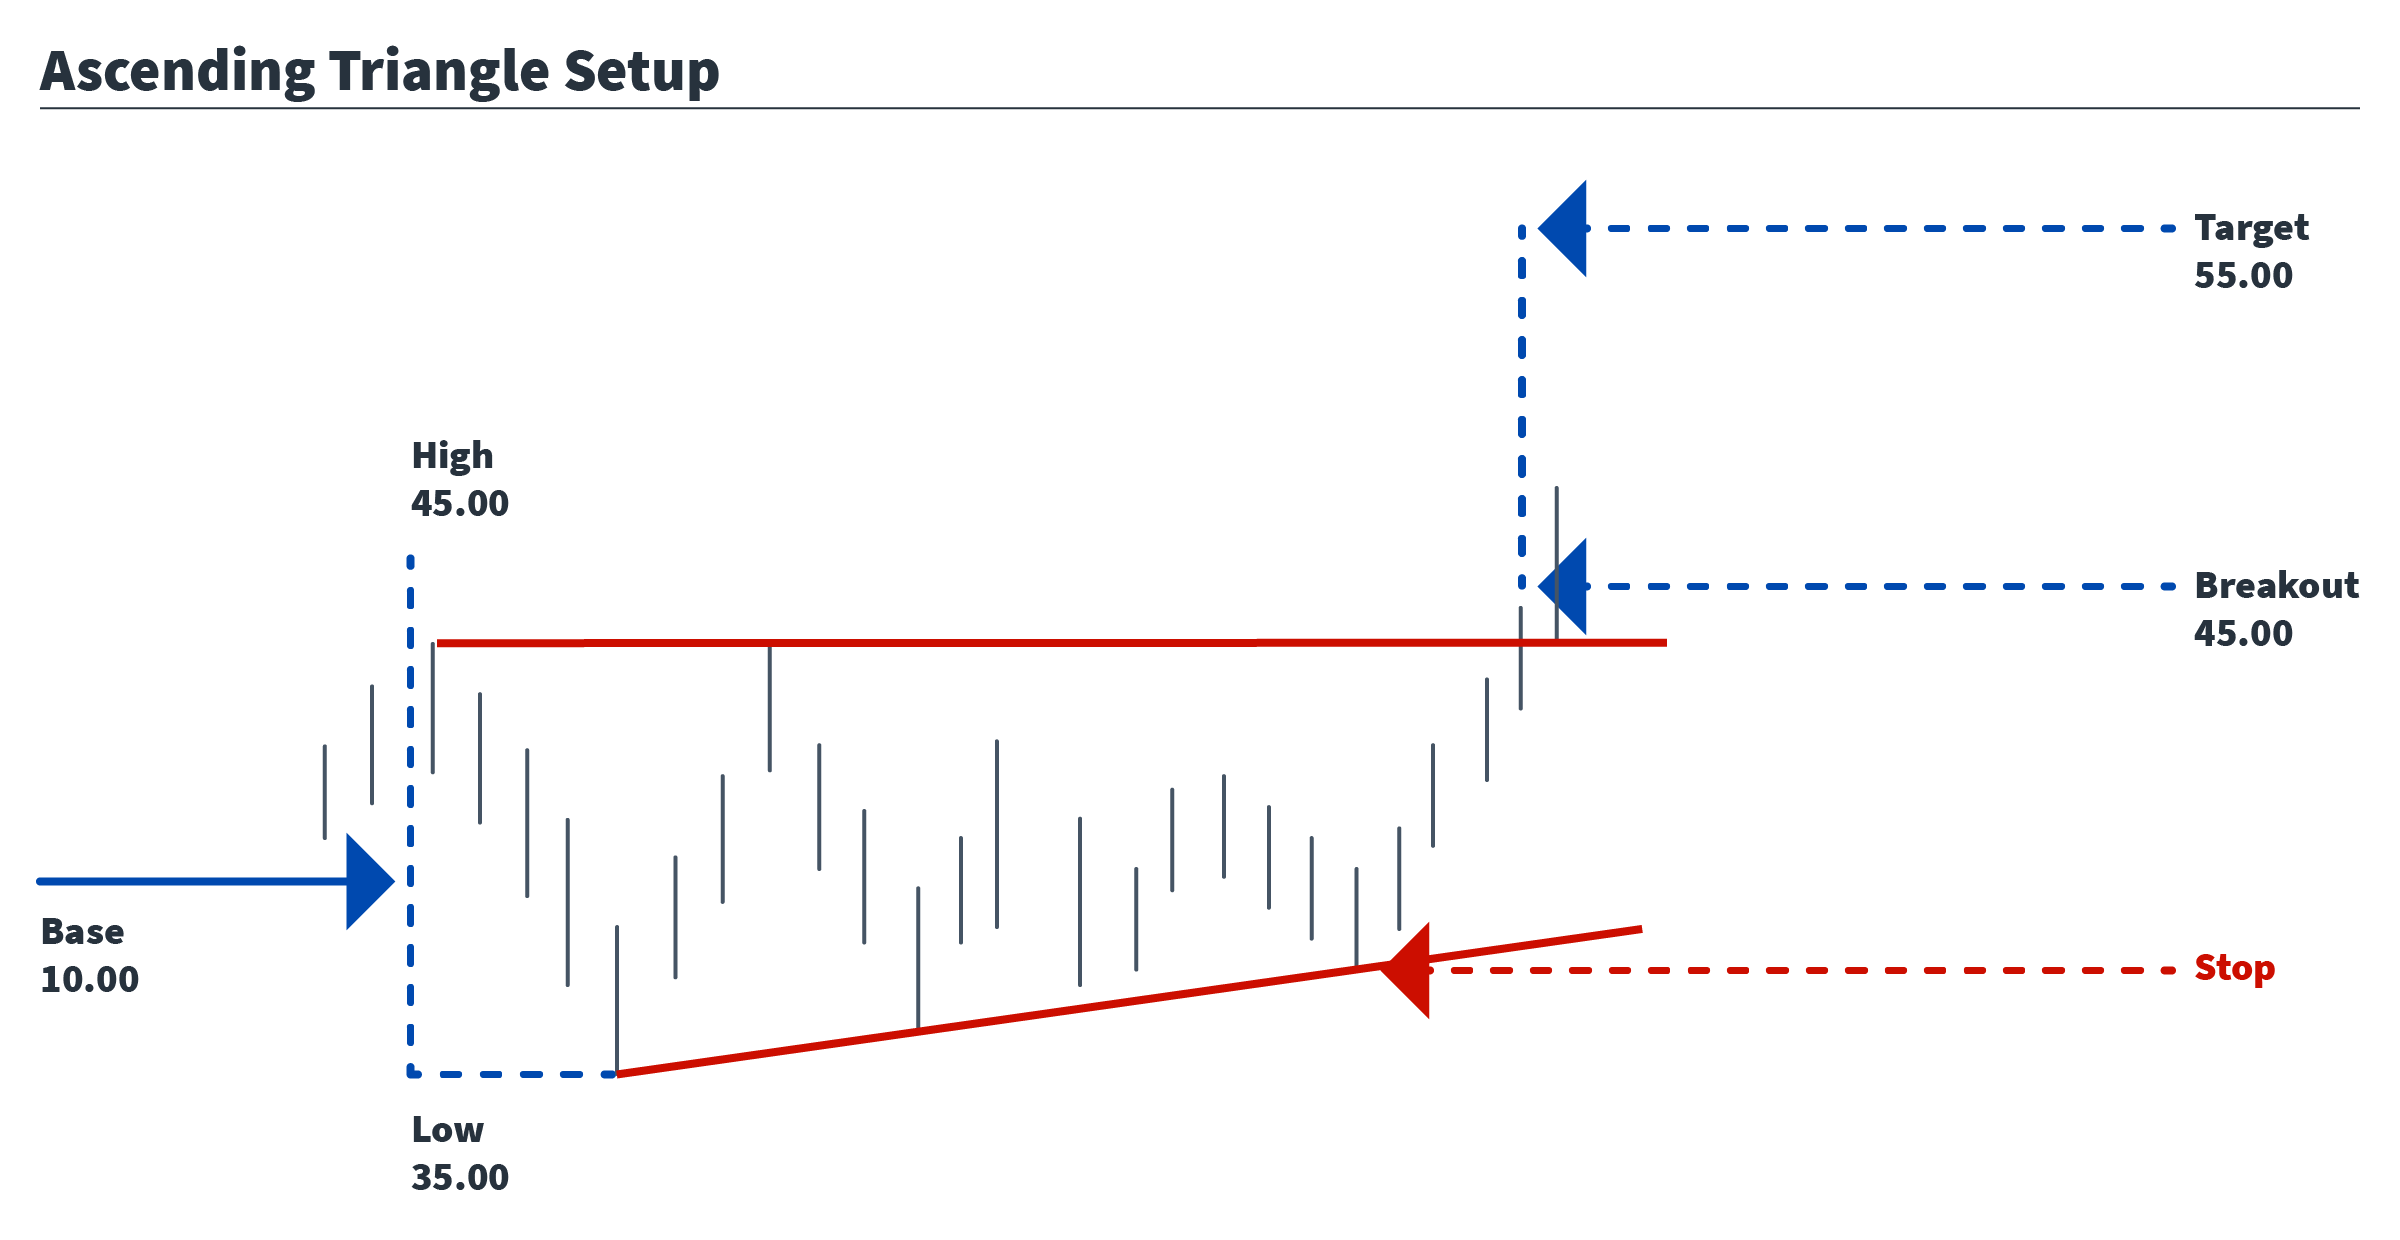
The profit target setup is the same as it is for the symmetrical triangle. Take the distance between the highest and lowest points at the base of the triangle and measure it from the breakout price. So, when the market begins to move sideways, and 4 reversals points have been plotted, take the difference between the high and first low, this is then the distance price should be expected to move after the breakout.
So, if a triangle produces a high print of $45.00 and a low print of $35.00, that would give a base value of $10.00. If the breakout price is $45.00, then $55.00 becomes the target.

The same principles that applied to ascending triangles also apply to descending triangles, they are simply inverted.
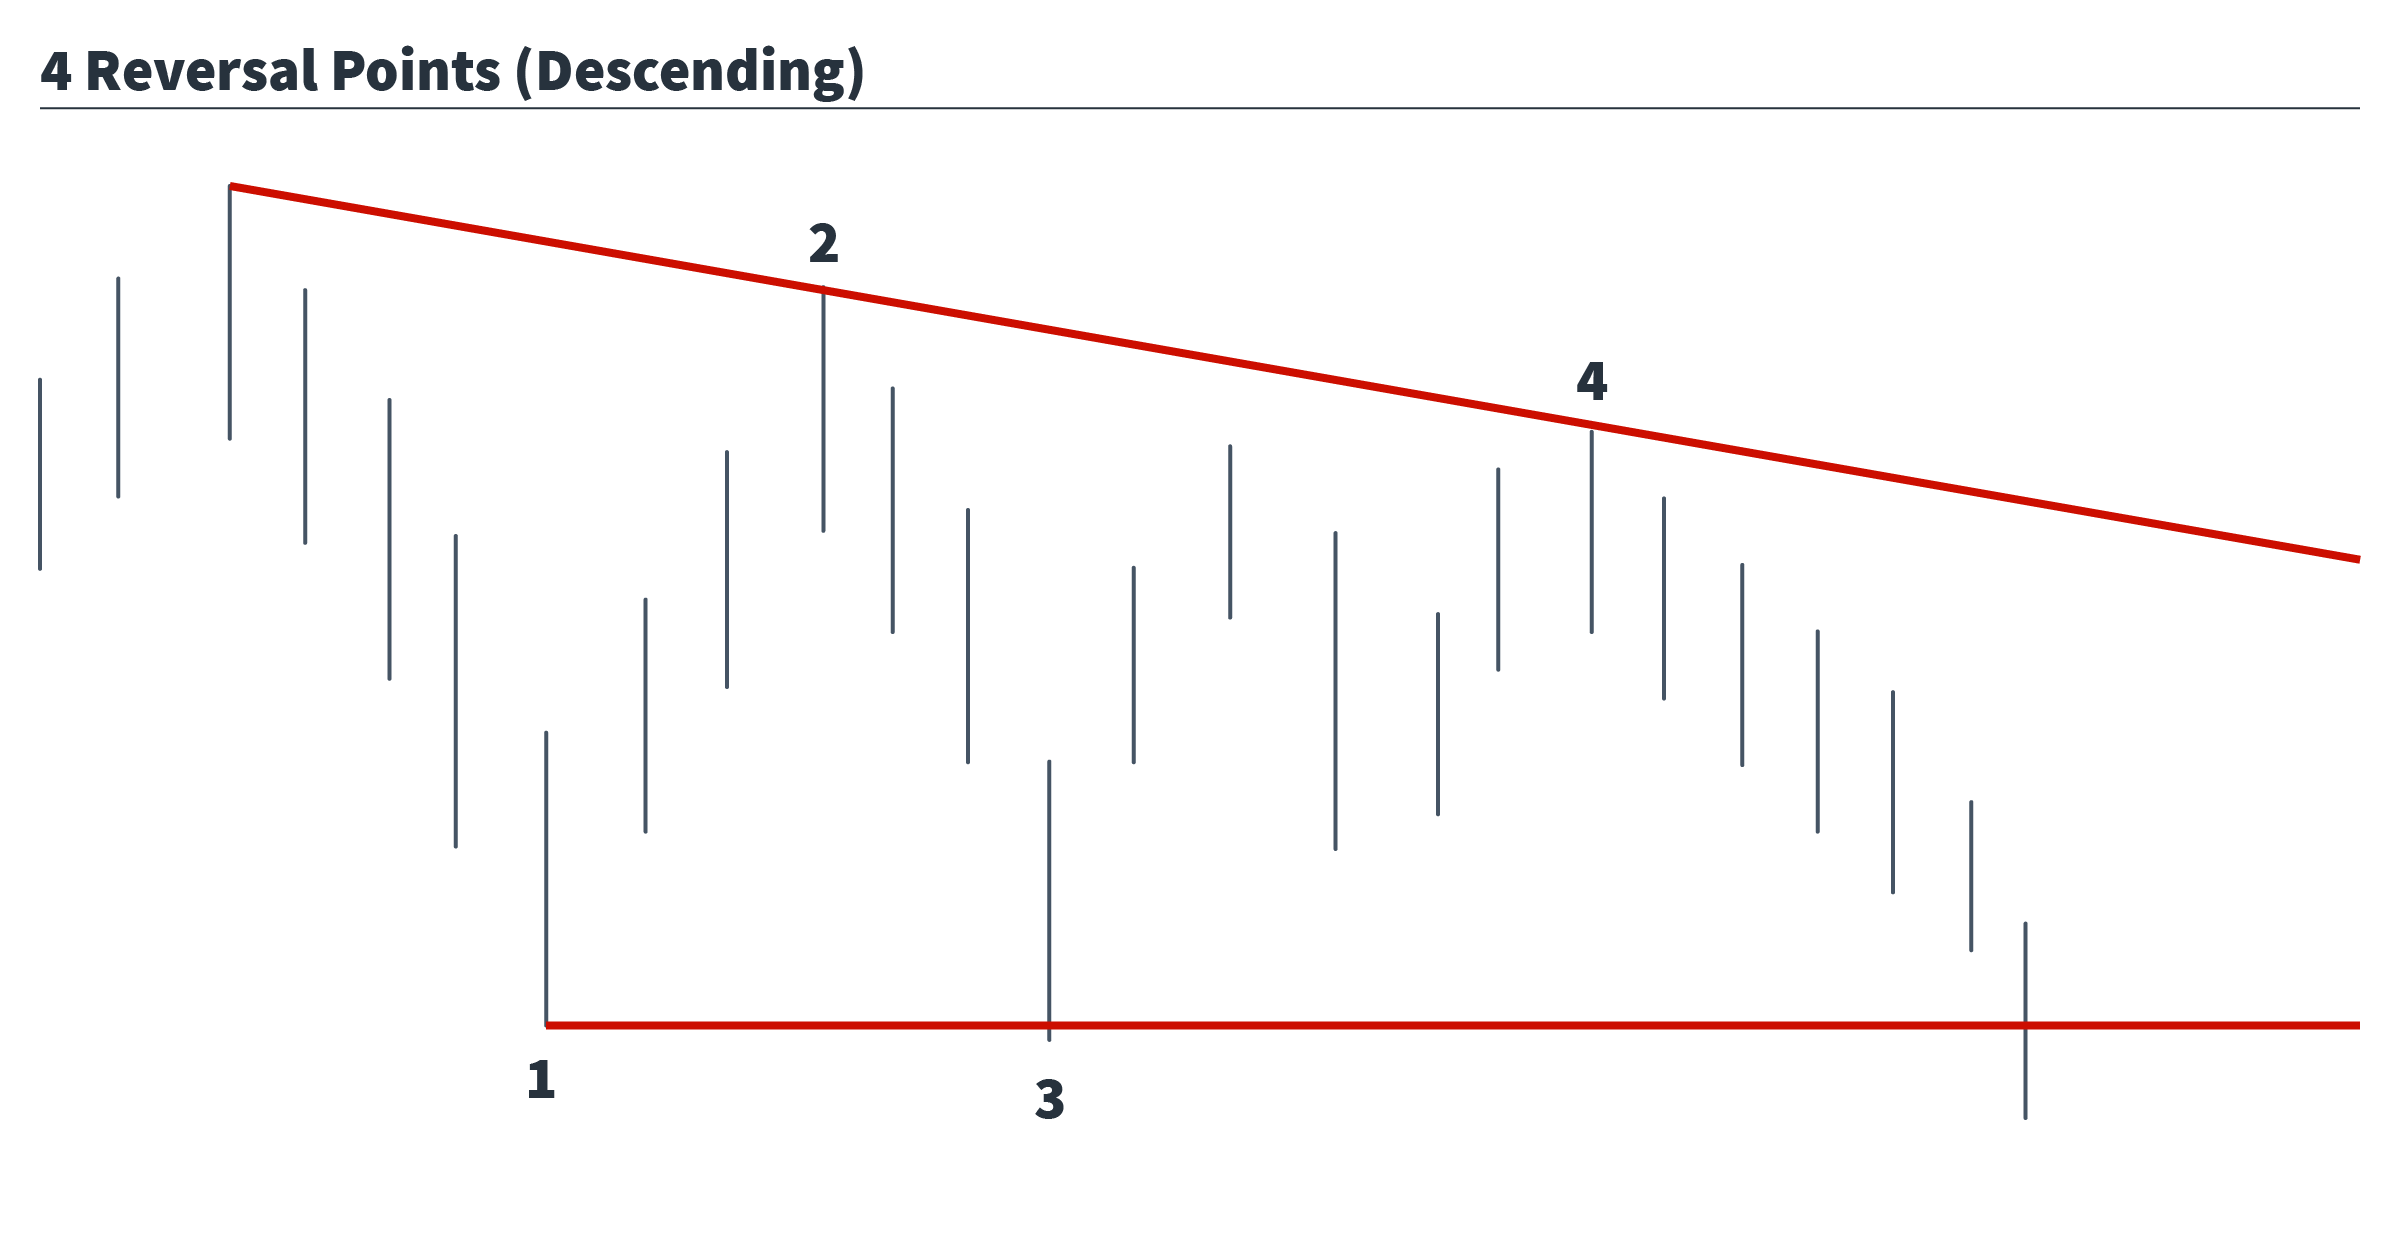
The descending triangle is a bearish chart pattern consisting of 2 trendlines converging towards an apex. In a descending triangle, the bottom line is horizontal, representing a typical support area, while the top line descends downwards, showing a series of lower highs. There must be a minimum of 4 reversal points in order for this to be considered a triangle pattern.

As price begins to consolidate, you should again expect to see a drop in volume. A breakout occurs when the support level is breached, and confirmed with a price bar closing outside of the triangle on increased volume.
False breakouts are also very common with this setup. Weak shorts are often tested with a run at upside stops before the downside breakout is confirmed.
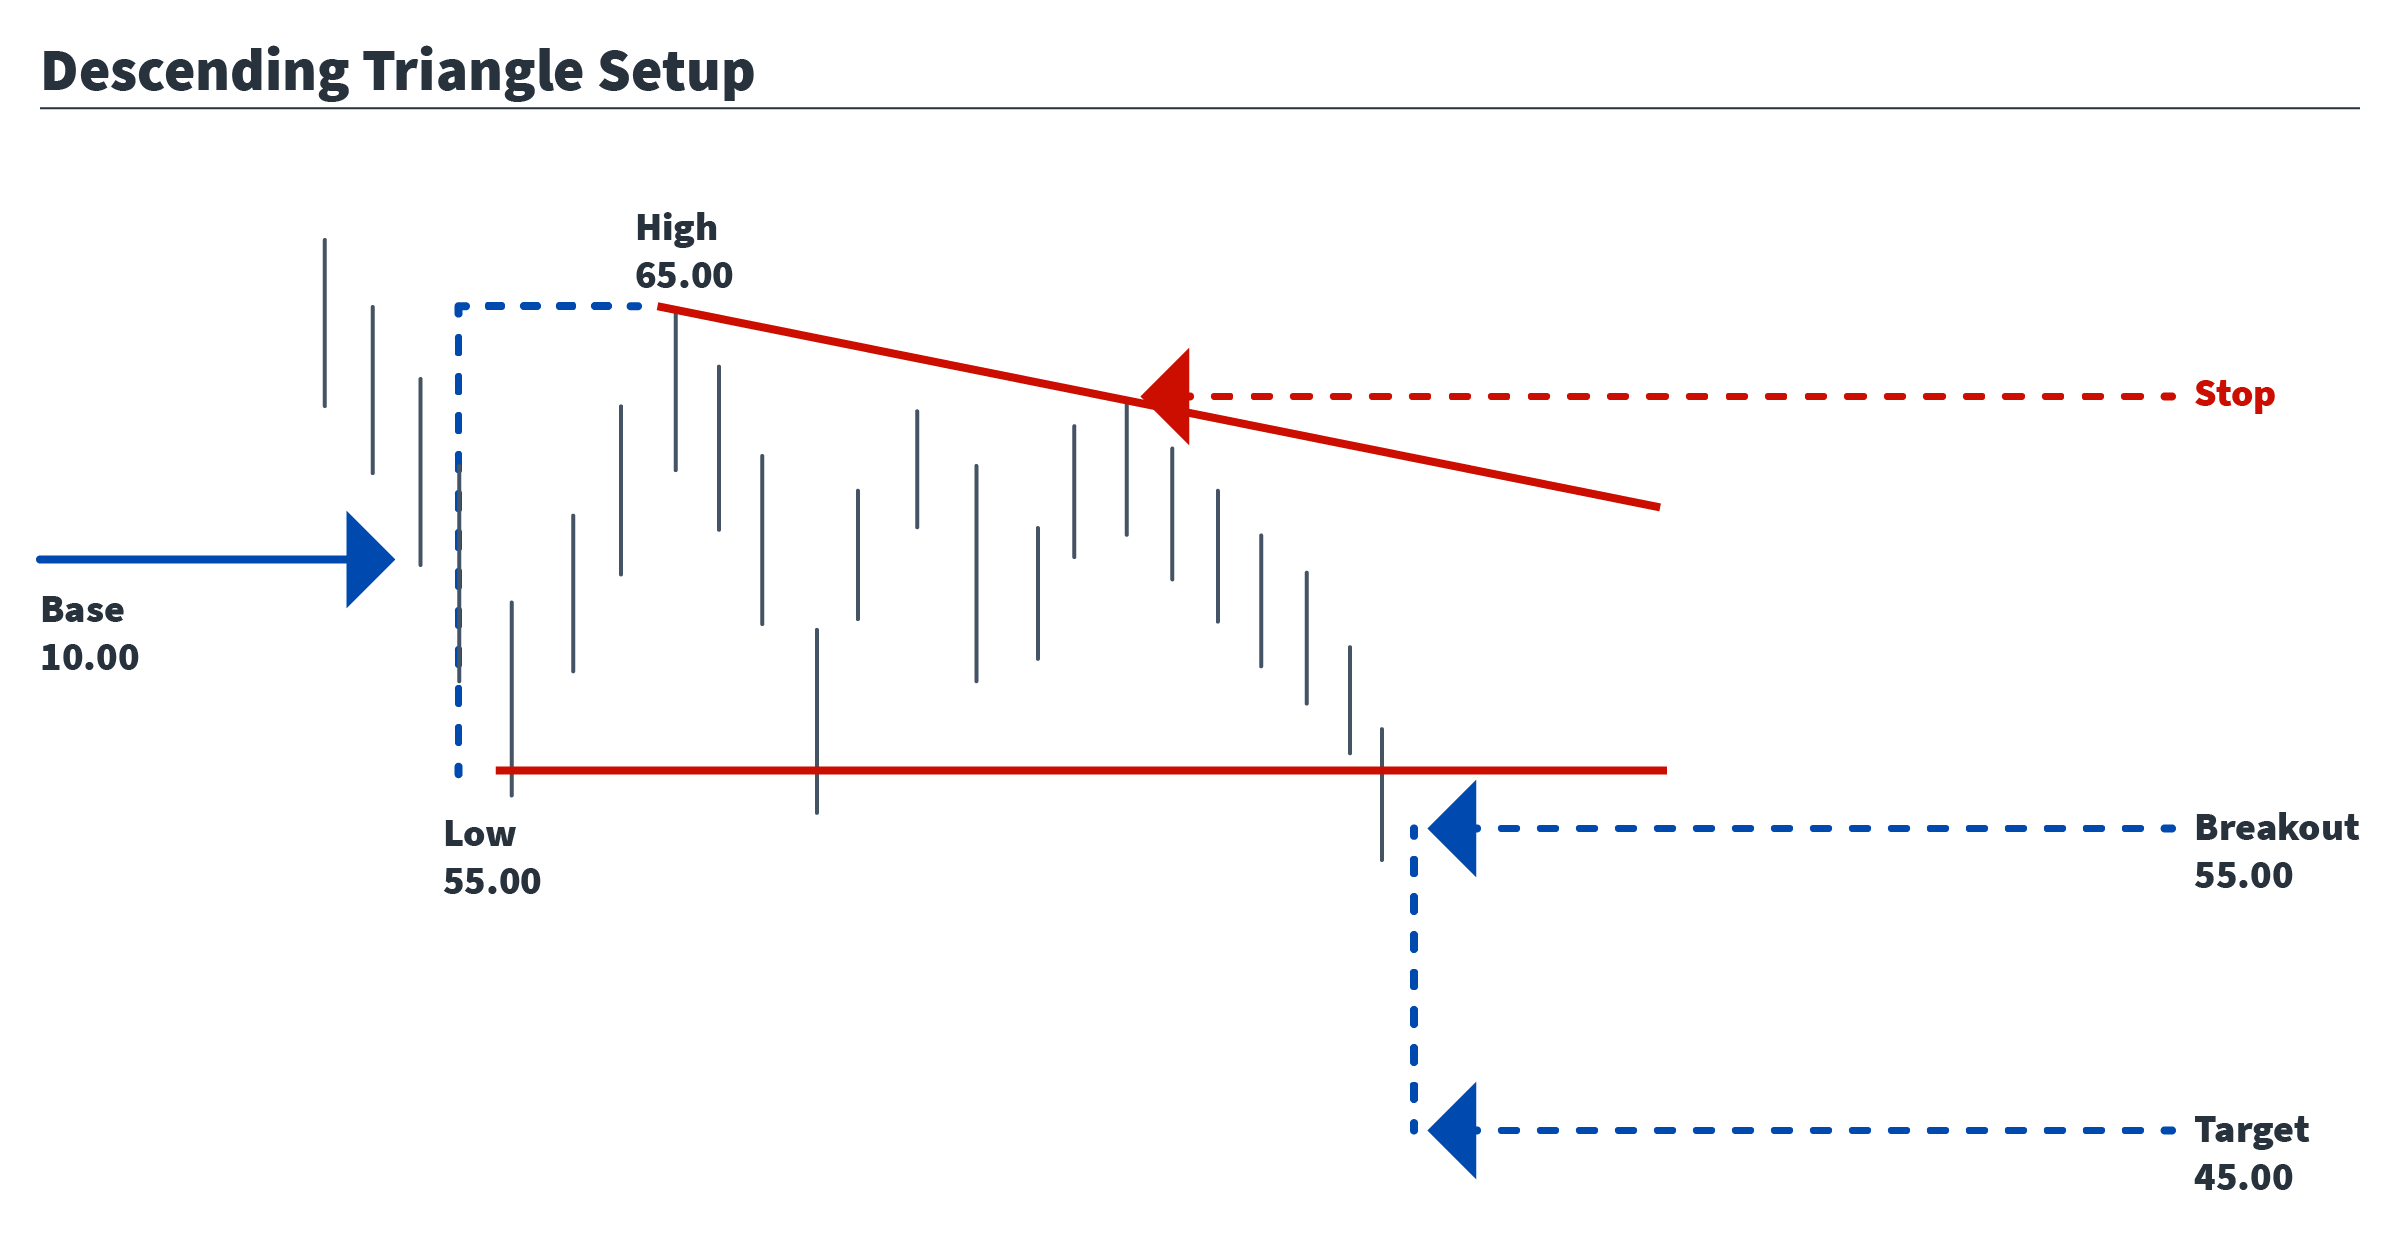
The profit target setup is the same as it is for the ascending triangle. Take the distance between the lowest and highest points at the base of the triangle, then measure it from the breakout price.
When the market begins to consolidate and 4 reversals points have been made, take the difference between the low and first high, this is then the distance price should be expected to move after the breakout.
So, if a triangle produces a low print of $55.00 and a high print of $65.00, that would give a base value of $10.00. If the breakout price is $55.00, then $45.00 becomes the target.

Stops can be adjusted based on your entry price for this setup, but should never fall below the 2:1 risk/reward ratio.
Trade Well!
