Home › Market News › Topstep Trading 101: Triple Tops
The purpose of this series is to educate newer traders on the basic principles and techniques of technical analysis. To a lot of you, this is old news, but for the rest of you, we are here to help you build a solid foundation for reading price charts.
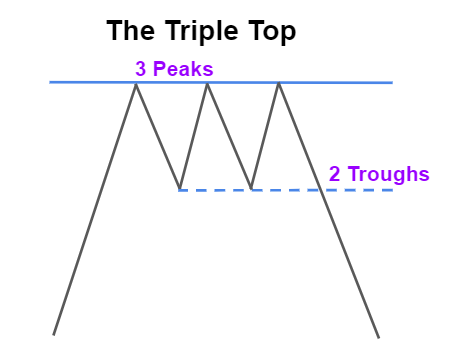
In this lesson we will be looking at Triple Tops. The triple top formation is a chart pattern formed at market tops that signals a potential trend reversal. This pattern consists of 3 peaks and 2 troughs, and can be found on any timeframe, but must be preceded by an uptrend.
The weight of this pattern relies heavily on the time it takes to form and the size of the moves between peaks and troughs. The longer and wider the formation is, the more reliable the reversal pattern becomes. So, just like with double tops; price, time and volume are all key components to this pattern.
Triple tops are commonly found at key resistance areas, and represent multiple unsuccessful attempts of buyers to break through that level. Because this pattern represents a period of price consolidation, it can easily be mistaken for a rectangle formation while it is setting up. The difference between the triple top and the rectangle is that the triple top can only have a maximum of five reversal points, while a rectangle has no limit on reversal points.

A trendline should easily be drawn connecting the three peaks, this represents the resistance area. Another trendline should be drawn connecting the 2 troughs, this becomes your support, or breakout line.
Similar to other reversal formations, volume patterns should match up with price to give further confirmation. The first peak should be made on significantly higher volume than the following two, with a noticeable decrease in volume around the troughs. A breakout should then occur in tandem with a spike in volume.
Prices at the peaks don’t need to be an exact match, but multiple price bars closing above the resistance level will more than likely lead to a false pattern signal. A price bar closing below the trough line on high volume will signal confirmation of the pattern.
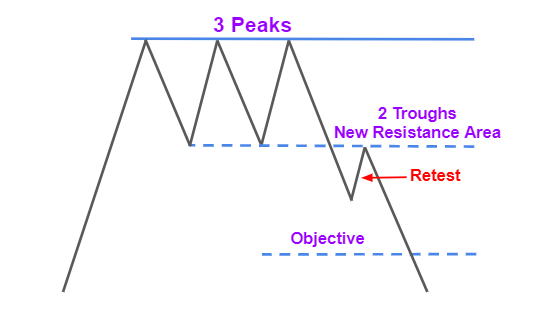
The measured move for a triple top is the distance between the lowest trough and the highest peak. This distance should then be measured downward from the breakout point to determine the price objective.
Confirmation of the triple top must be made with a price bar closing below the lower trendline before a position should be initiated.
The support line connecting the two troughs turns into a resistance level after the breakout has occurred, and it’s common to see a retest of this level before the price objective is met. More aggressive traders will often use a retest as an opportunity to add on to their position if the volume and time patterns are also signaling a strong probability of continued trend reversal.

The most obvious place to put a stop would be just above the upper trendline. If buyers make another run at higher prices, the probability of a fourth peak is low, and the pattern is most likely broken, so a continuation of trend can be assumed.
Another stop area could be the 50% retracement level from the breakout. Since the support line connecting the two troughs becomes a significant resistance level after the breakout, a conservative stop area would be half the distance of the measured move. It’s also safe to use bollinger bands or short term moving averages as stop levels.
There is no substitute discipline and proper risk management when it comes to exiting a trade.
Trade Well!
