

TopstepX
Platform Updates
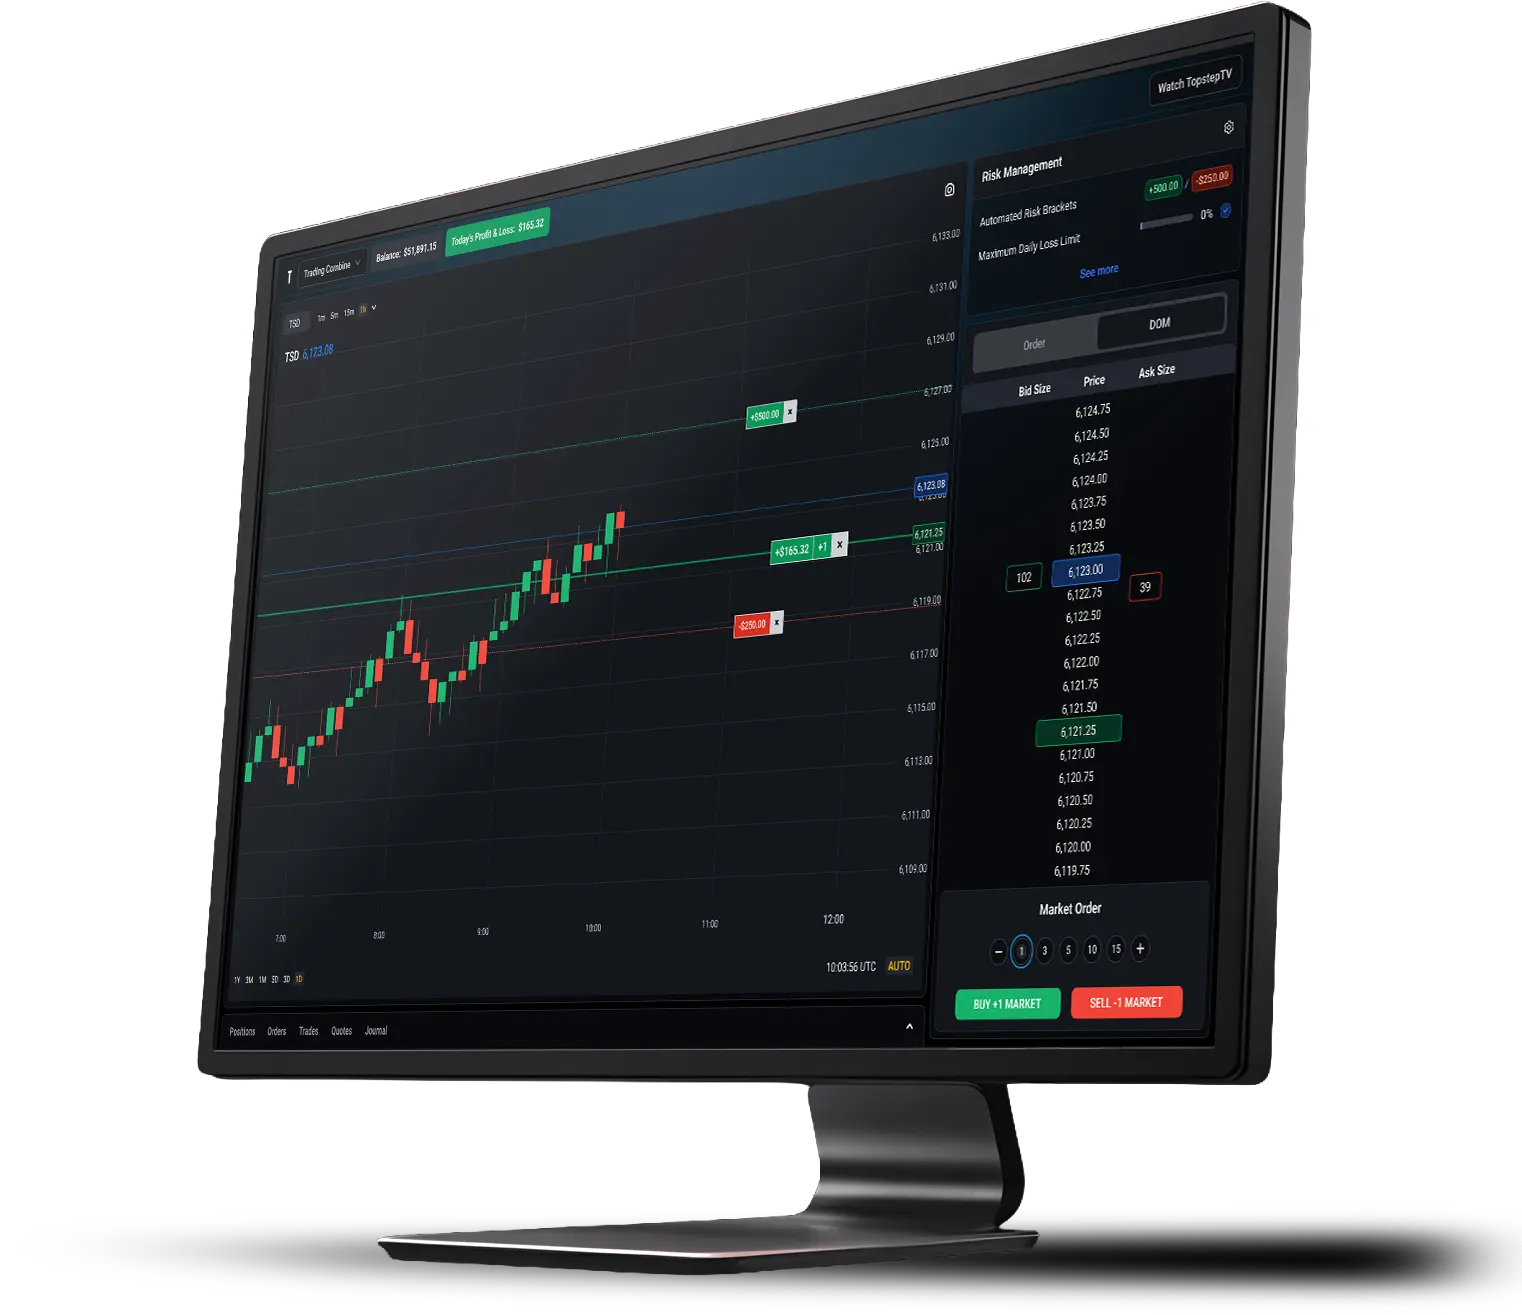
Most Recent Platform Updates
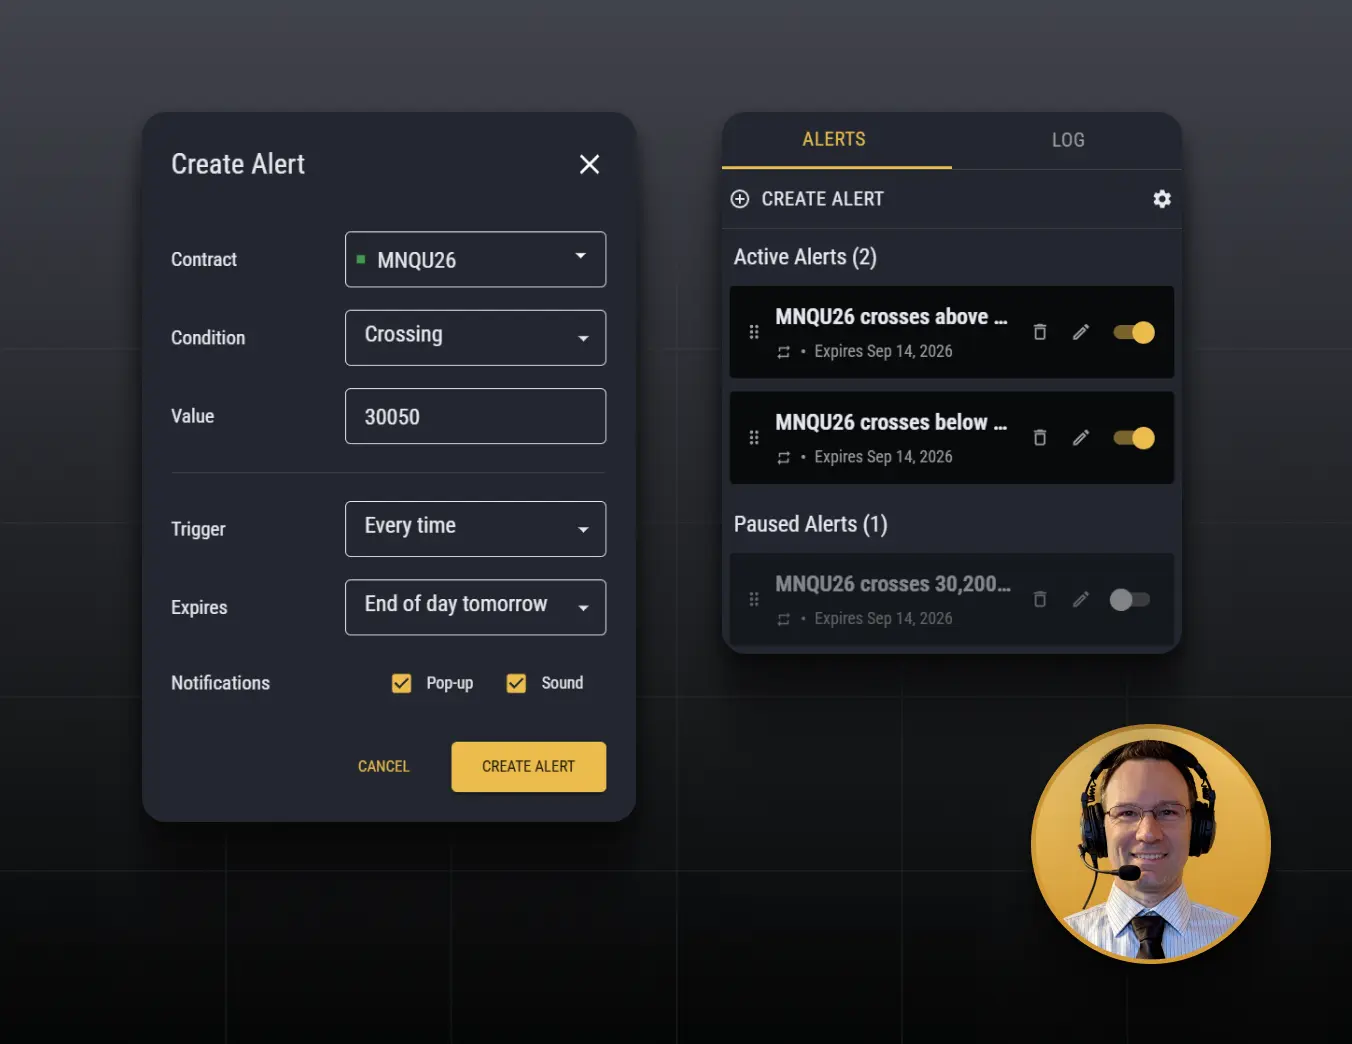
Price Alerts
What it is
Generates an alert should the last traded price of an instrument cross a price level that you are monitoring. Displays as a pop-up notification on the chart and produces and audible tone.
Who it's for
It's great for when you need to step away from your trading desk, but don't want to miss out on a potential trading opportunity.
TopstepX Cumulative Volume Delta Indicator
See who's being more aggressive: buyers or sellers.
Price tells you where the market is moving. Cumulative Volume Delta (CVD) gives you another view by tracking the difference between aggressive buying and aggressive selling throughout the trading day.
If price and CVD are moving in the same direction, that can show participation behind the move. If they start moving in different directions, traders may take a closer look.
The Full Indicator Lineup
TopstepX Fair Value Gaps Indicator
Spot areas where price moved fast.
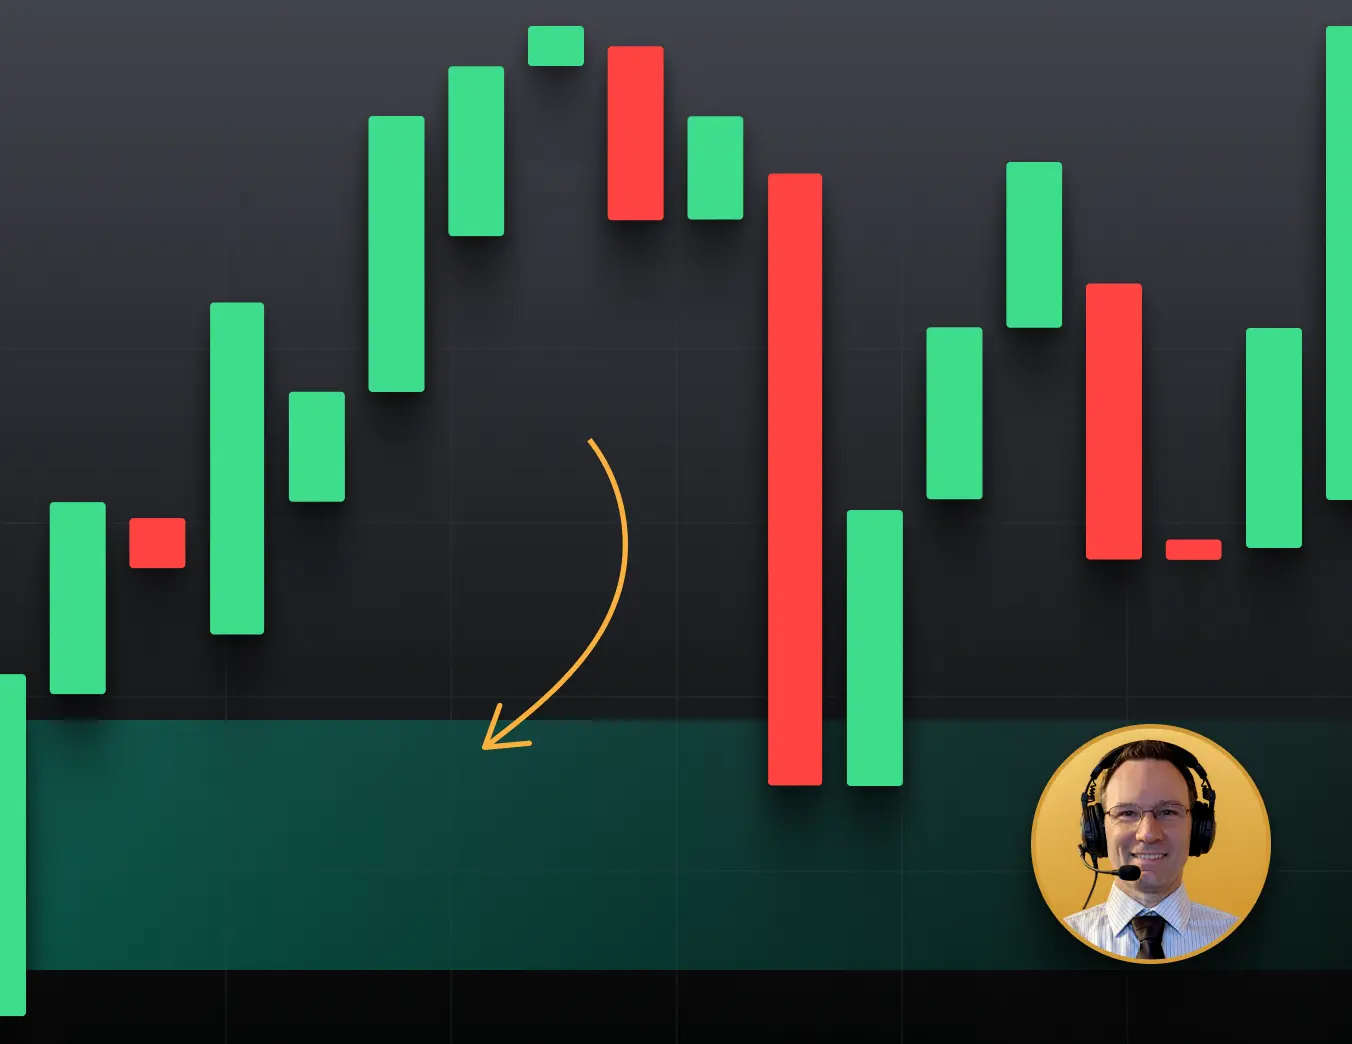
A Fair Value Gap (FVG) shows an area where price moved so quickly that it left a gap between candles. This indicator finds and shades those areas for you.
If price later trades back through the gap, it can become an Inverse Fair Value Gap (IFVG). Traders may then watch that area differently the next time price returns.
TopstepX Fair Value Gaps Indicator
How traders use it: Watch these zones when price returns to them and use them as another piece of context for potential support, resistance, or a change in direction.
Why it helps: Finds and shades these areas automatically, so you don't have to draw them yourself. You can also adjust how far back it looks and whether filled gaps stay on your chart.
TopstepX Cumulative Volume Oscillator
See whether buying or selling pressure is gaining strength.
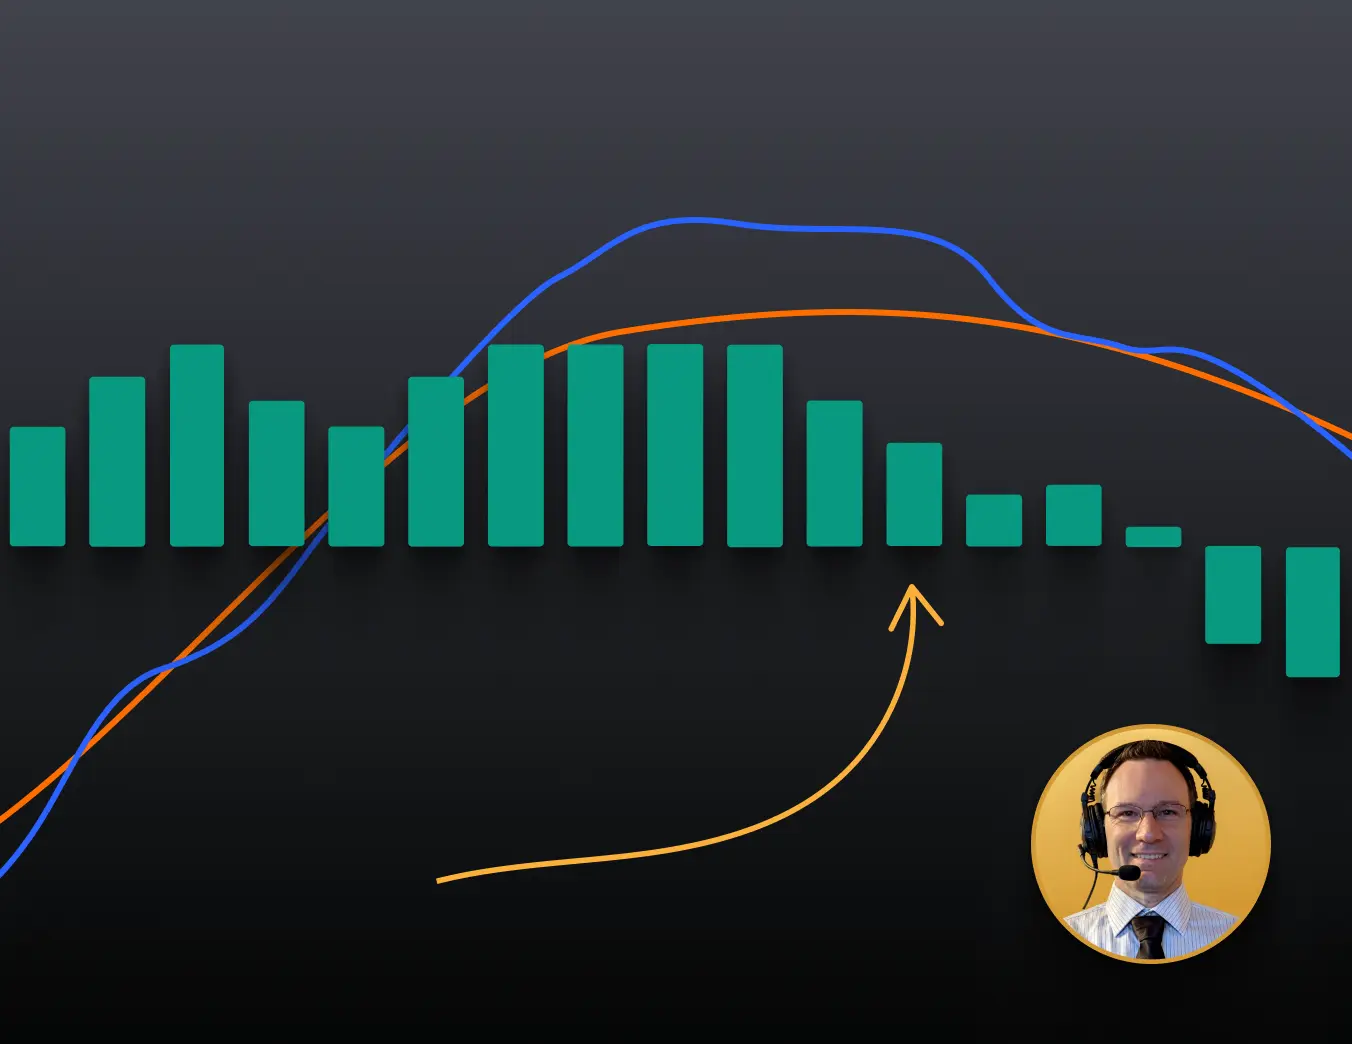
The Cumulative Volume Oscillator takes Cumulative Volume Delta and turns it into an oscillator similar to MACD.
You don't need to understand the math to read it. The indicator can help show whether buying or selling pressure is building, fading, or changing direction.
TopstepX Cumulative Volume Oscillator
How traders use it: Watch for shifts in buying and selling momentum and compare them with what price is doing.
Why it helps: Turns order-flow data into a simple visual that's quicker to read, with adjustable settings to fit your trading style.
TopstepX Cumulative Volume Delta Indicator
See who's being more aggressive: buyers or sellers.
Price tells you where the market is moving. Cumulative Volume Delta (CVD) gives you another view by tracking the difference between aggressive buying and aggressive selling throughout the trading day.
If price and CVD are moving in the same direction, that can show participation behind the move. If they start moving in different directions, traders may take a closer look.
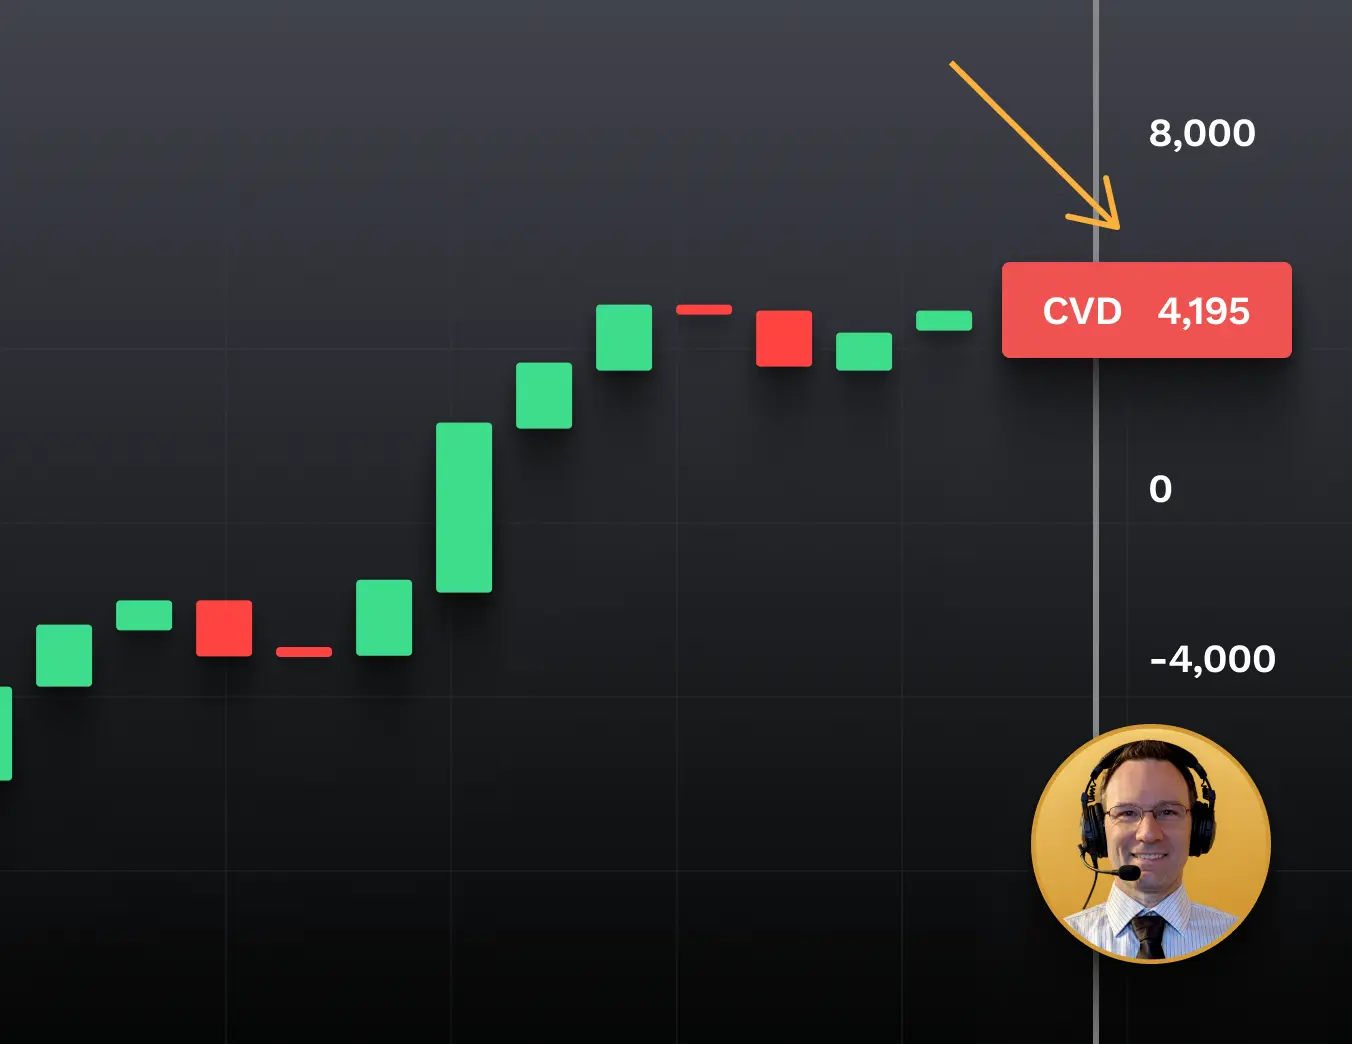
TopstepX Cumulative Volume Delta Indicator
How traders use it: Compare CVD with price to better understand the buying or selling pressure behind a move.
Why it helps: Gives you another way to read what's happening behind price and resets each trading day for a fresh look at the session.
TopstepX Range Filter Indicator
Filter out the little moves and focus on the bigger ones.
Markets can move back and forth constantly without really going anywhere. Range Filter is designed to ignore smaller price changes until the market moves far enough to matter based on the settings you choose.
The line stays flat during smaller moves and steps higher or lower when a larger move develops. Bands around the line create a channel for additional context.
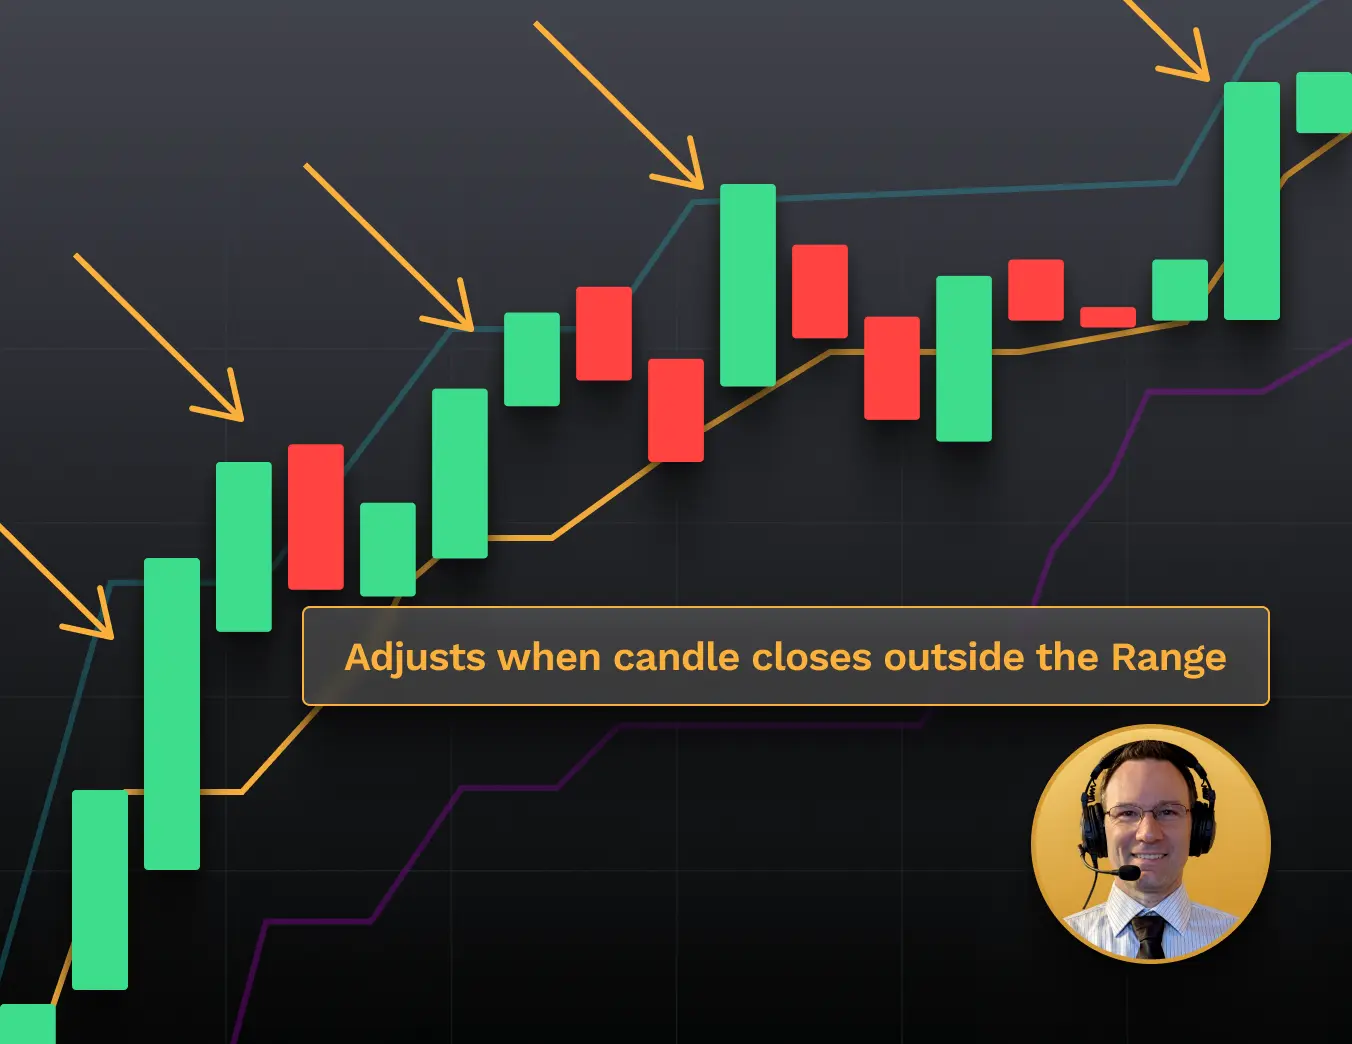
TopstepX Range Filter Indicator
How traders use it: Watch the direction of the steps to help separate a developing trend from smaller market noise.
Why it helps: Cleans up choppy price action and gives you a simpler view of market direction.
TopstepX VWMA Bands Indicator
See price through the lens of trading volume.
A Volume-Weighted Moving Average (VWMA) is a moving average that gives more importance to periods with heavier trading volume.
This indicator adds bands around that average that expand and contract as market conditions change. Together, they can show the overall trend and how far price has moved away from its recent volume-weighted average.
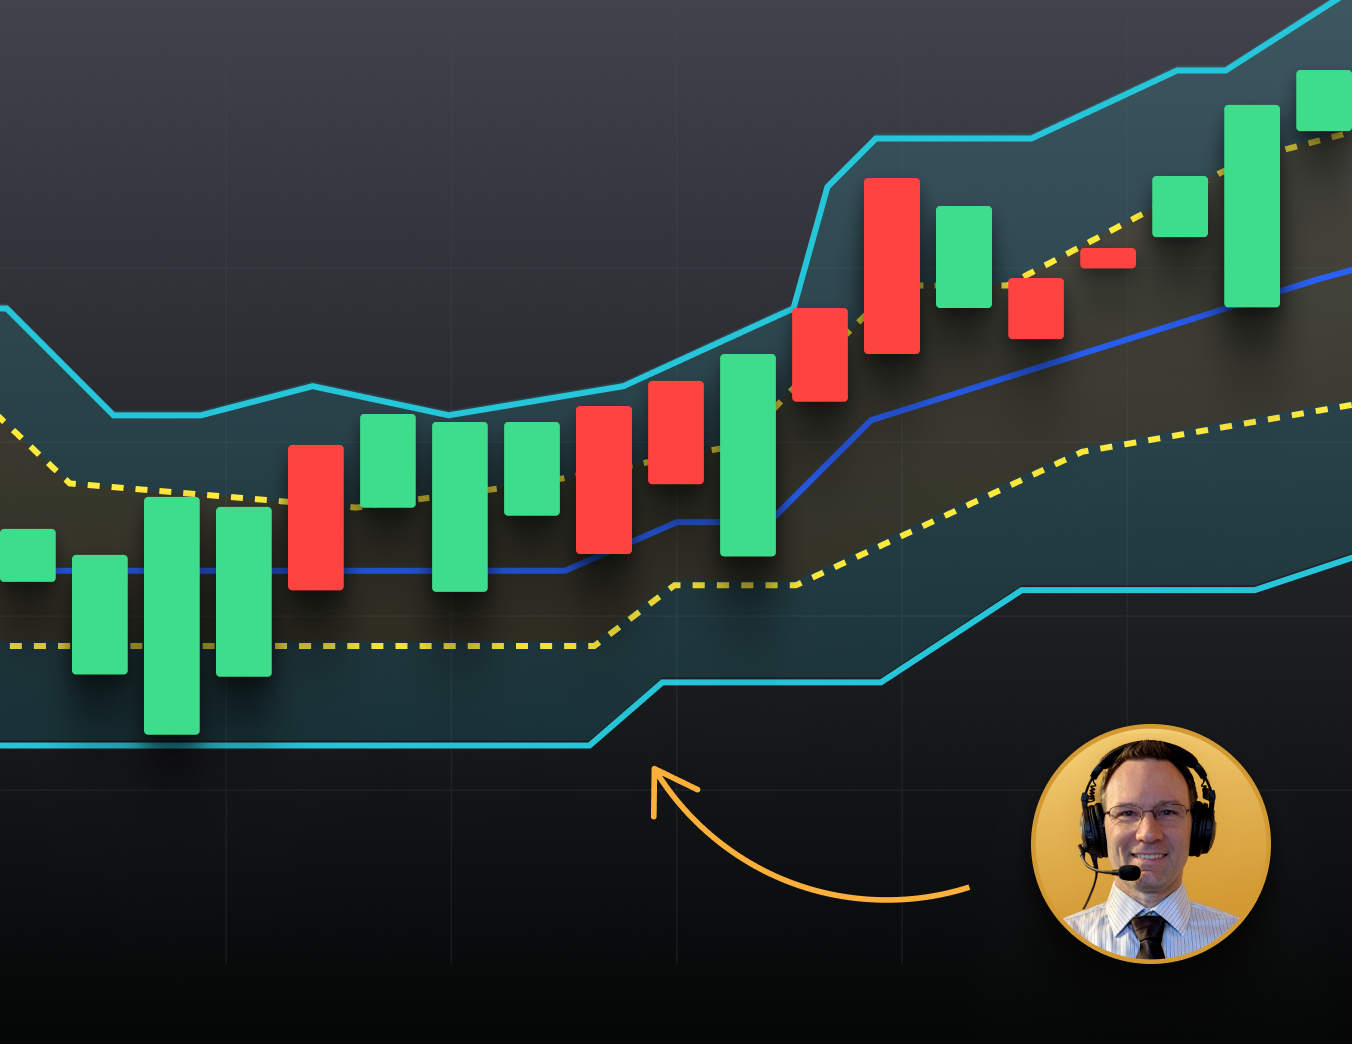
TopstepX VWMA Bands Indicator
How traders use it: Follow the center line for trend context and use the bands to see when price is moving farther away from its recent average.
Why it helps: Gives more weight to price moves with higher participation and automatically adjusts its bands as market conditions change.
TopstepX Squeeze Momentum Indicator
Spot when a quiet market may be getting ready to move.
Markets often move between periods of lower and higher volatility. Squeeze Momentum helps identify periods when volatility has tightened or “squeezed.”
The indicator also includes a momentum histogram that can help show which direction momentum is moving and whether it's getting stronger or weaker.
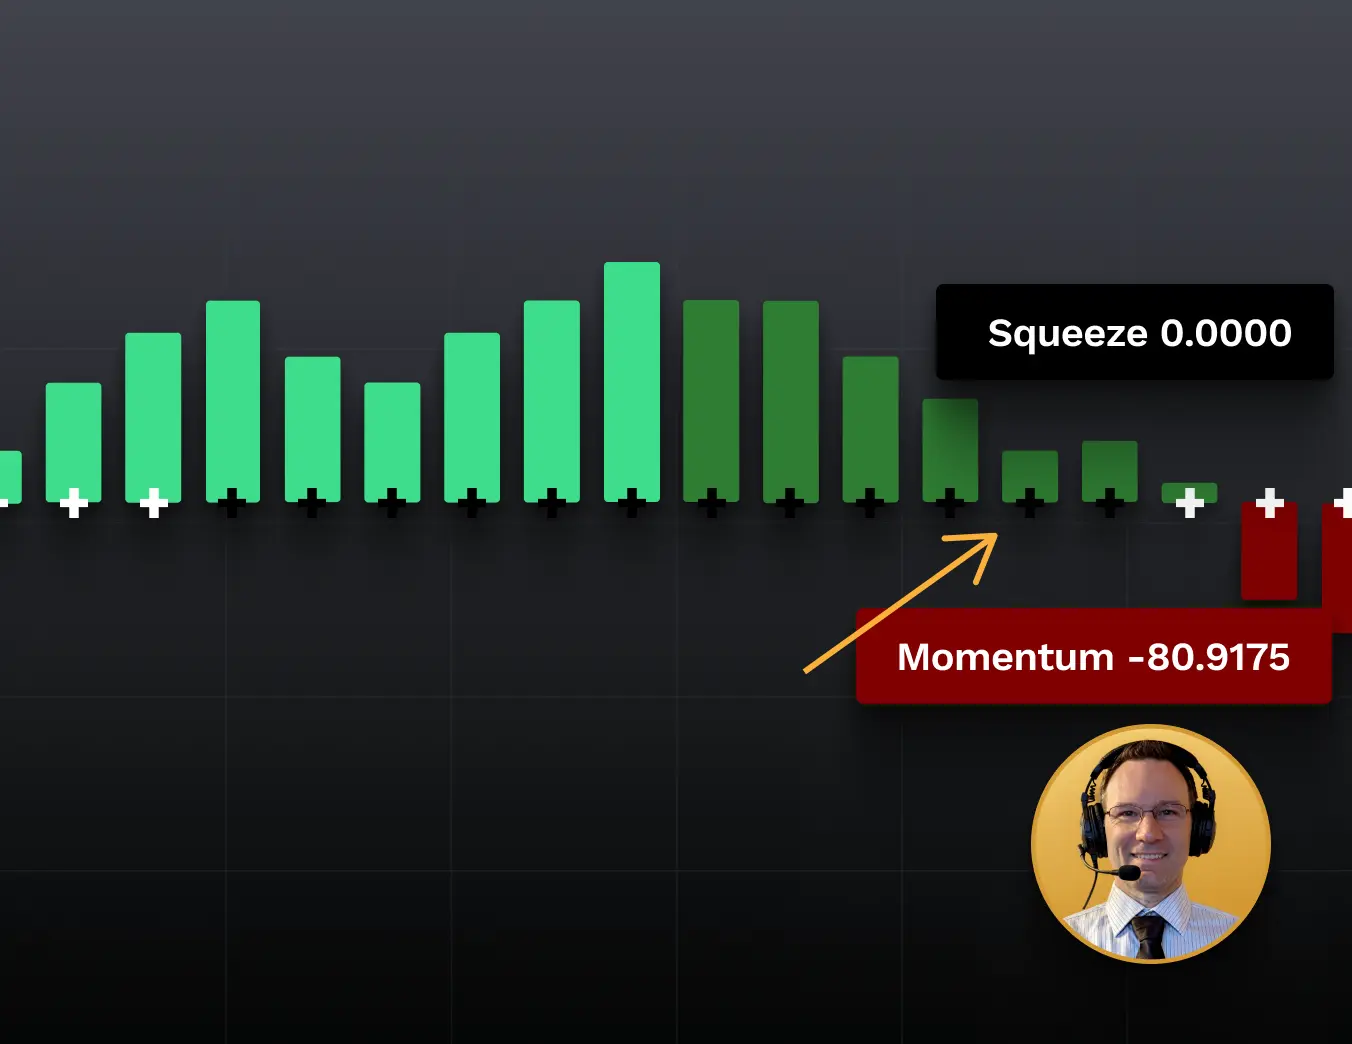
TopstepX Squeeze Momentum Indicator
How traders use it: Watch for a squeeze to end, then use the momentum reading for more context around the move that follows.
Why it helps: Puts volatility compression and momentum together in one easy-to-follow indicator.
TopstepX TDI or (Trade Dynamic Index) Indicator
Momentum and volatility in one indicator.
The Traders Dynamic Index (TDI) combines RSI, moving averages, and volatility bands into one view.
The basic idea is simple: Is momentum picking up, slowing down, or getting stretched? The movement of the lines and their position inside the bands can help you read those changes.
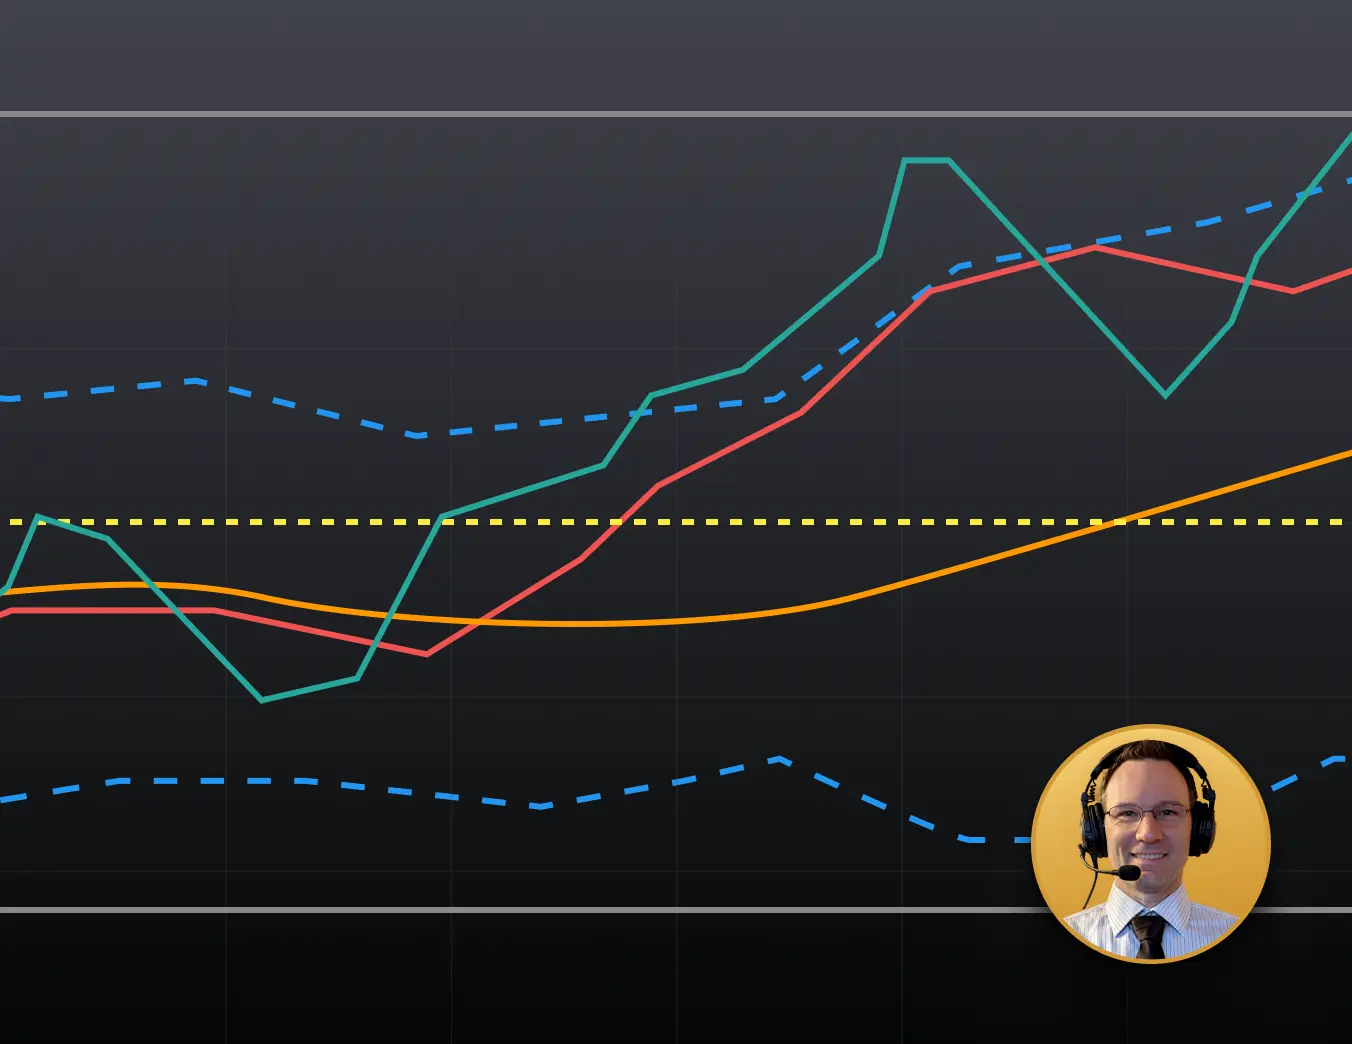
TopstepX TDI or (Trade Dynamic Index) Indicator
How traders use it: Look for changes in momentum, get a quick read on market direction, and see when momentum may be getting stretched.
Why it helps: Combines several momentum and volatility reads into one indicator, with settings you can adjust to your timeframe.
TopstepX Trend Cycle Indicator
See where momentum may be in its cycle.
Trend Cycle combines ideas from MACD and Stochastic indicators to create a smoother momentum read that moves between upper and lower extremes.
Rather than focusing on every small price change, it can help you see when momentum has become stretched and may be starting to turn.
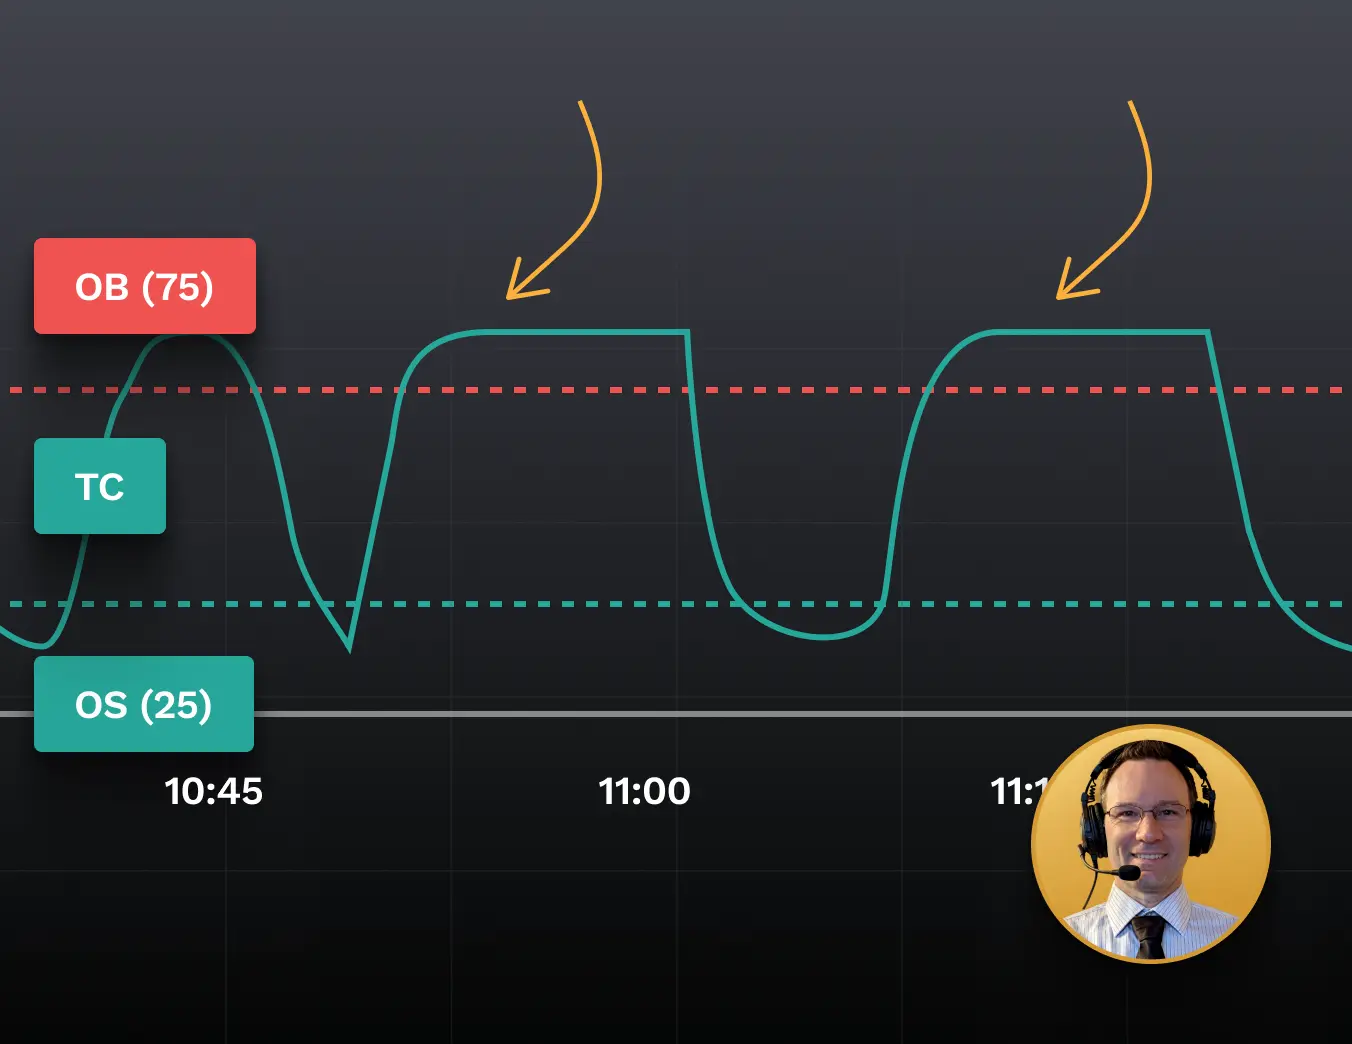
TopstepX Trend Cycle Indicator
How traders use it: Watch for momentum to reach an extreme and then begin moving away from it, usually alongside another read on the overall trend.
Why it helps: Gives you a cleaner, faster visual for following changes in momentum.
TopstepX Wave Trend Indicator
Follow momentum as it moves in waves.
Wave Trend measures how far price has moved away from its recent average and smooths that information into two lines.
Those lines move above and below a center point, making momentum swings easier to see without reacting to every small price movement.
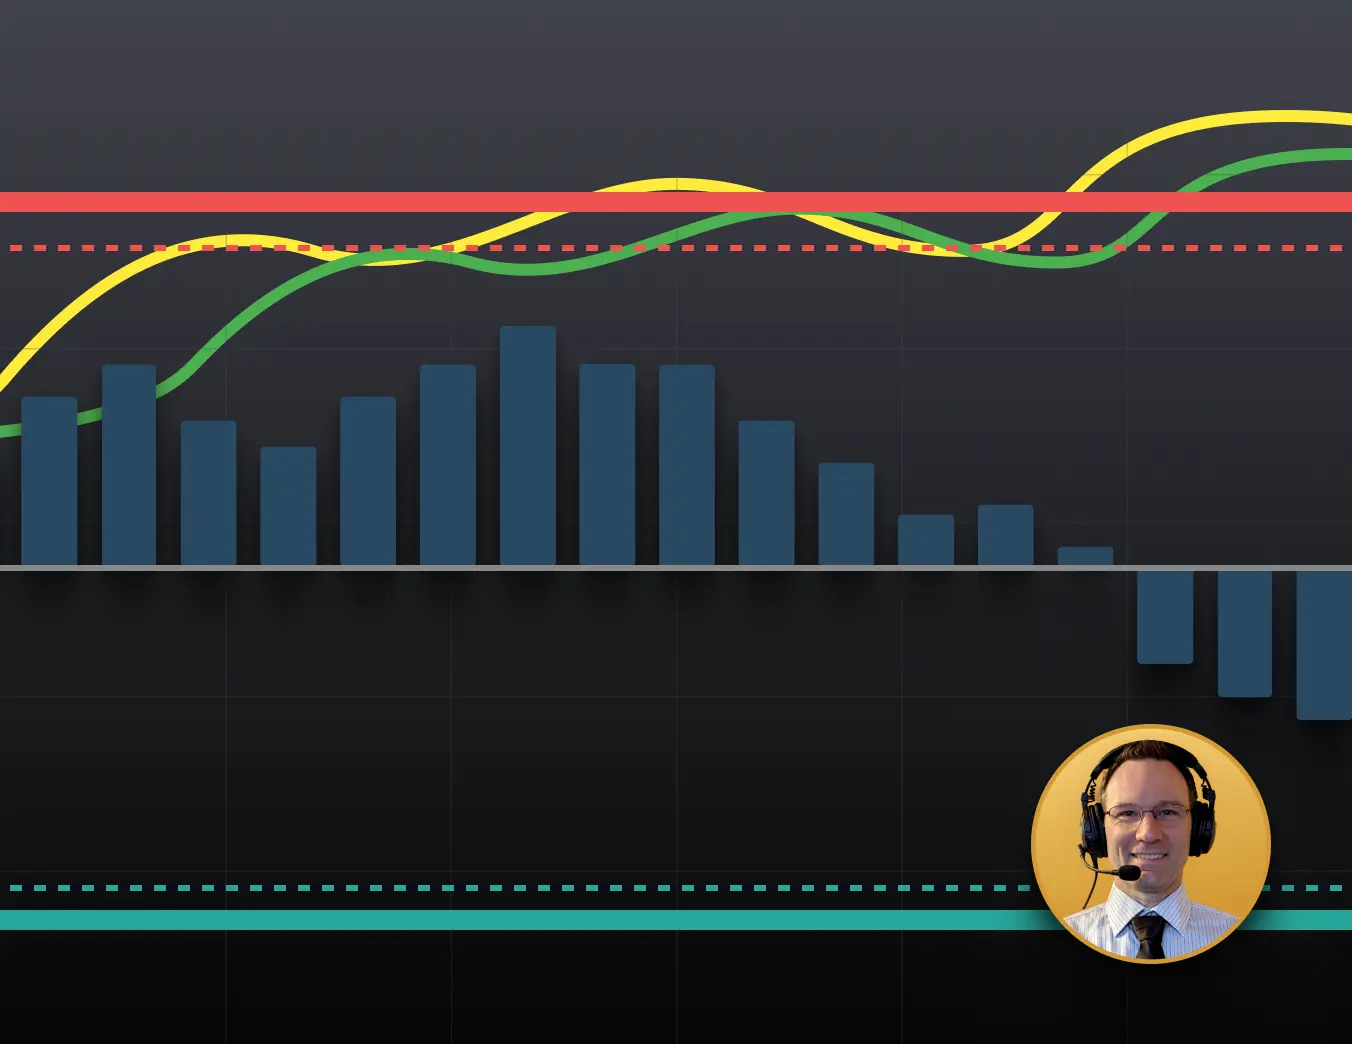
TopstepX Wave Trend Indicator
How traders use it: Watch the two lines for changes in momentum and look for stretched readings that may signal momentum is getting exhausted.
Why it helps: Filters out some short-term noise to give you a cleaner picture of momentum.
